Nov 26, 2025 | 6 minutes
How to automate executive sales reports with AI in Make
Learn how to transform raw sales data into polished executive reports, generate actionable insights with AI-powered analysis, create branded PDFs with charts, and deliver them automatically every Monday morning.
Imagine starting every Monday morning with an executive-ready sales report in your inbox. No sifting through spreadsheets, no last-minute formatting, just a clear, AI-powered summary with charts and insights to help you make decisions faster!
With Make, you can transform raw sales data into polished, scheduled reports that tell the story of your week. In one scenario, data flows from a spreadsheet, through AI commentary, into polished charts, and finally into a branded PDF that is automatically delivered to executives at 8 AM every Monday.
Outcome: Weekly PDF (1–2 pages) with an AI summary, KPIs, charts, and recommendations.
Who it’s for: Sales managers, executives, agency owners, and analysts.
Why it matters: Saves 5–10 hours each week while keeping leaders aligned with timely insights.
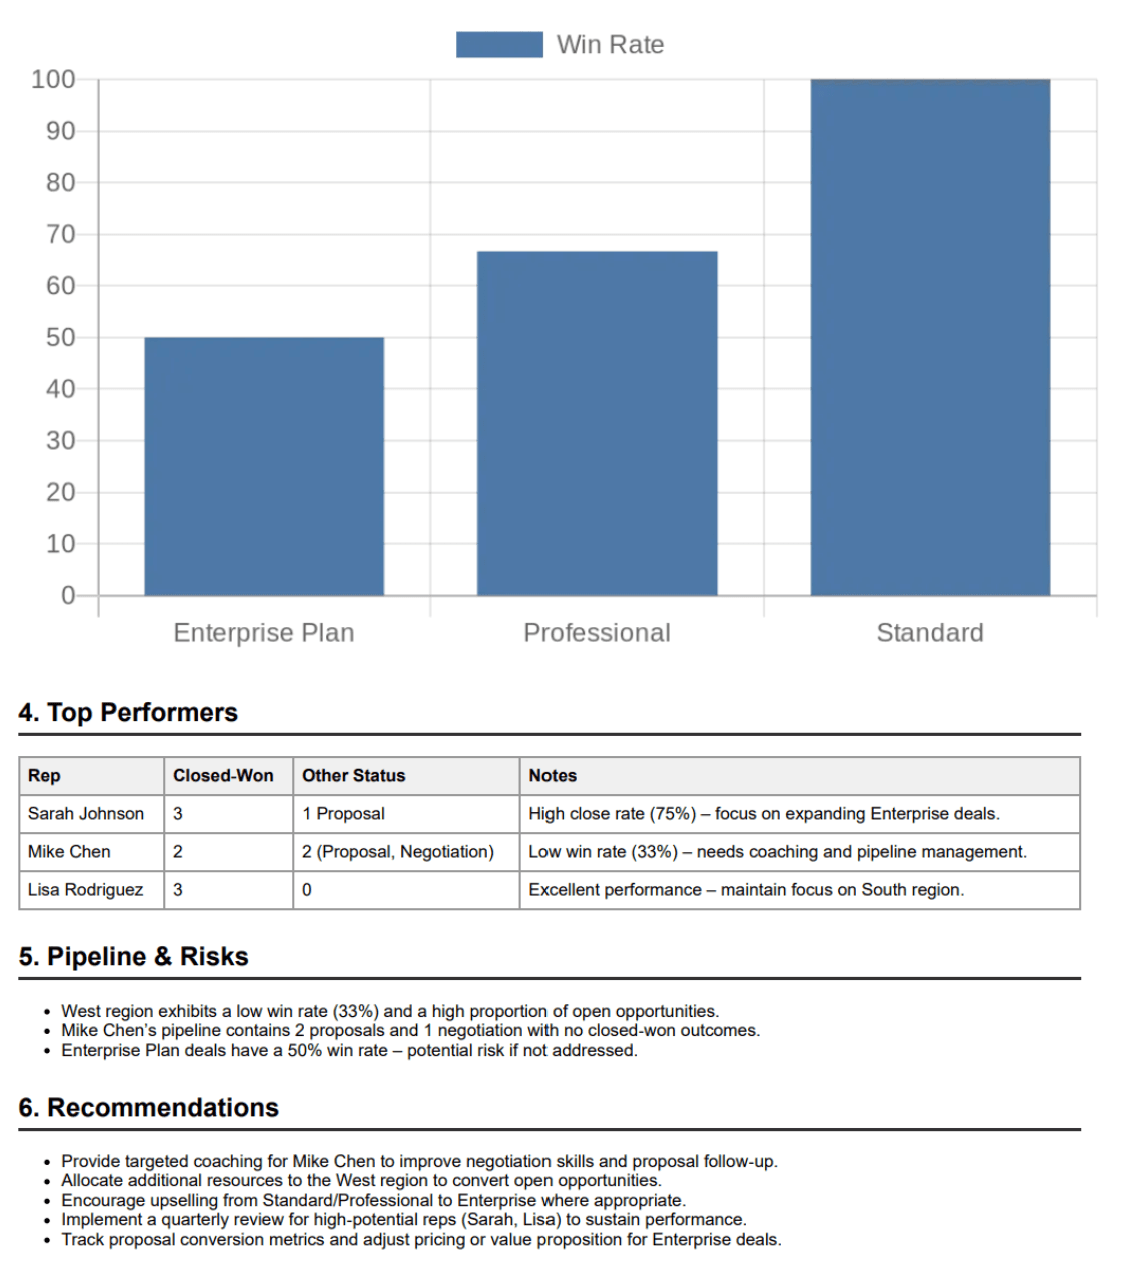
A sample executive report (page 2) generated by the Make workflow.
Why is it good?
Preparing reports manually is time-consuming, and by the time they’re ready, opportunities to act may have slipped by. Automation flips this into an opportunity: instead of spending hours on formatting, teams can let Make handle it and start the week with insights that prompt action.
How the Workflow Comes Together
Here’s the simple five-step structure inside Make:
Google Sheets: sales data flows into one central sheet.
Tools (Filter + Text Aggregator): gather the right rows into a clean block of text.
AI Toolkit: generates a concise briefing and 3–5 recommendations.
PDF.co HTML→PDF: assembles summary, KPIs, and charts into a polished PDF.
Gmail (or other email): delivers the report automatically every Monday at 8 AM.
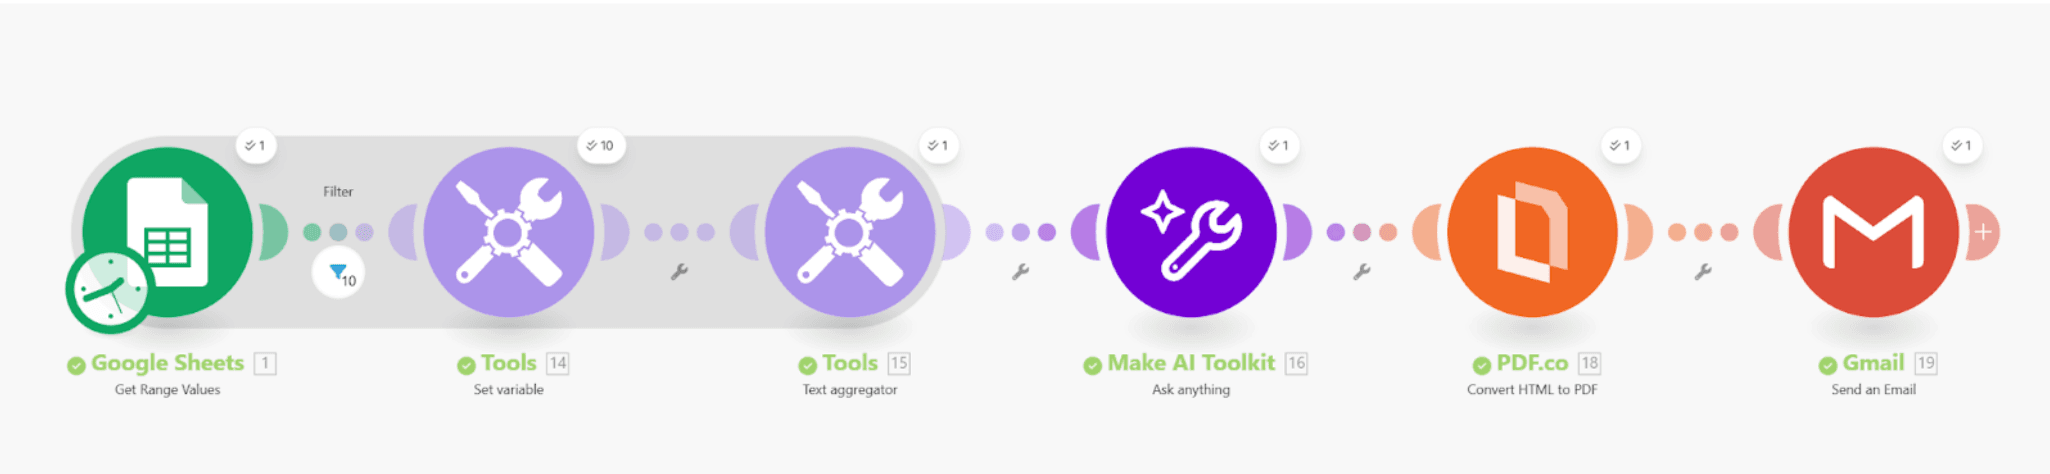
Scenario Canvas: Google Sheets → Set Variable → Text Aggregator → Make AI Toolkit Ask Anything → PDF.co HTML to PDF → Gmail
What executives receive
The finished report is designed to deliver a clear, actionable snapshot every week.
Page 1: Executive summary, top KPIs (revenue, closed-won, win rate), performance tables (by region and plan), top performers, and a short “Pipeline & Risks” section.
Page 2: A dedicated recommendations section that could contain five prioritized, actionable recommendations, plus any extended tables or appendix details if needed.
This layout keeps the first page concise and scannable while ensuring leaders always have clear next steps available.
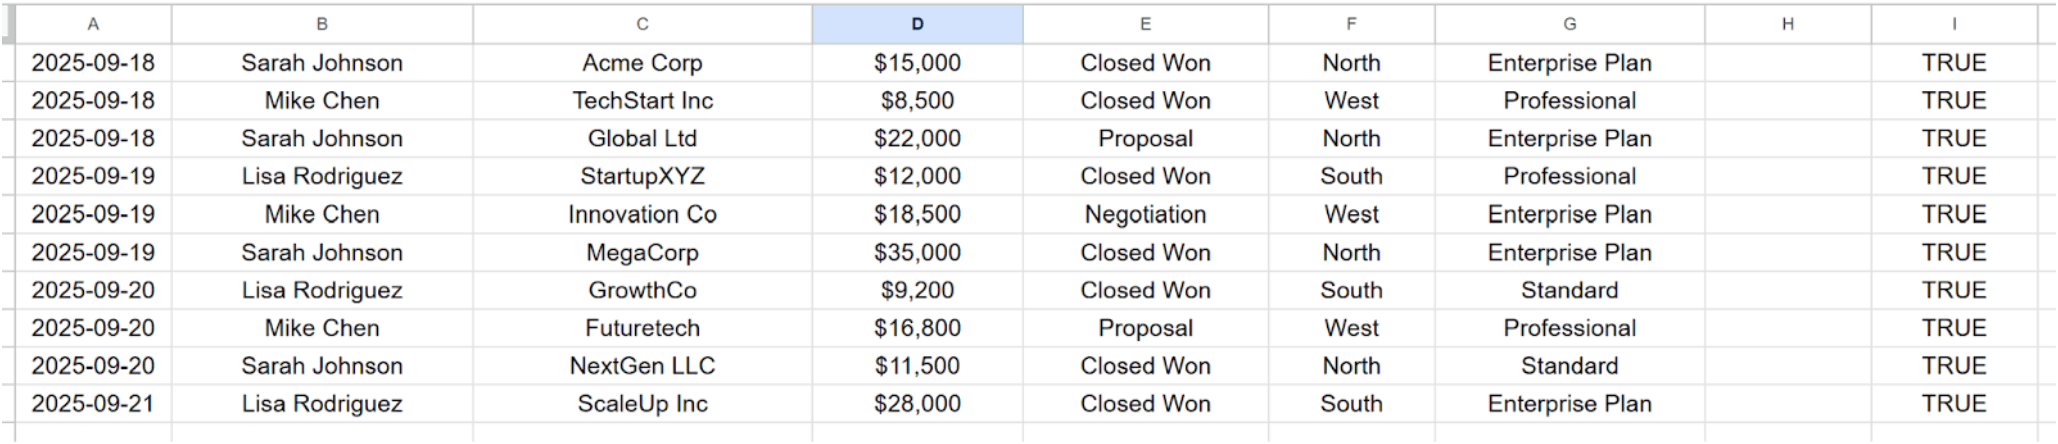
A simple Google Sheet serving as the data source for the report
Why this matters
Timely: Leaders open their inbox on Monday at 8 AM to actionable insights.
Empowering: Sales teams reclaim hours each week to focus on selling and coaching.
Consistent: Every report follows the same structure, making trends easy to spot.
Scalable: Agencies can adapt this workflow for multiple clients with minimal effort.
What’s the real-world impact?
Teams using this approach often find weekly meetings shift from “gathering numbers” to “discussing actions.” Executives feel confident starting their week, and sales teams know they’re focused on what really matters.
Ready to build?
Now let’s walk through exactly how to build this workflow in Make using Google Sheets, Tools, Make AI Toolkit, PDF.co, and Gmail.
Step 1. Prepare Your Google Sheet
Sheet name: Raw Sales Data
Columns: Date | Rep | Client | Amount | Status | Region | Plan | Notes | IncludeInReport
Formula for IncludeInReport:
=IF(AND(A2>=TODAY()-7, A2<TODAY()), TRUE, FALSE)
This flags only the last 7 days of sales data for inclusion in the report.
Step 2. Pull Sales Data
Module: Google Sheets → Get Range Values
Range: A1:I
Includes headers: false
Sheet: Raw Sales Data
This pulls all rows into the scenario.
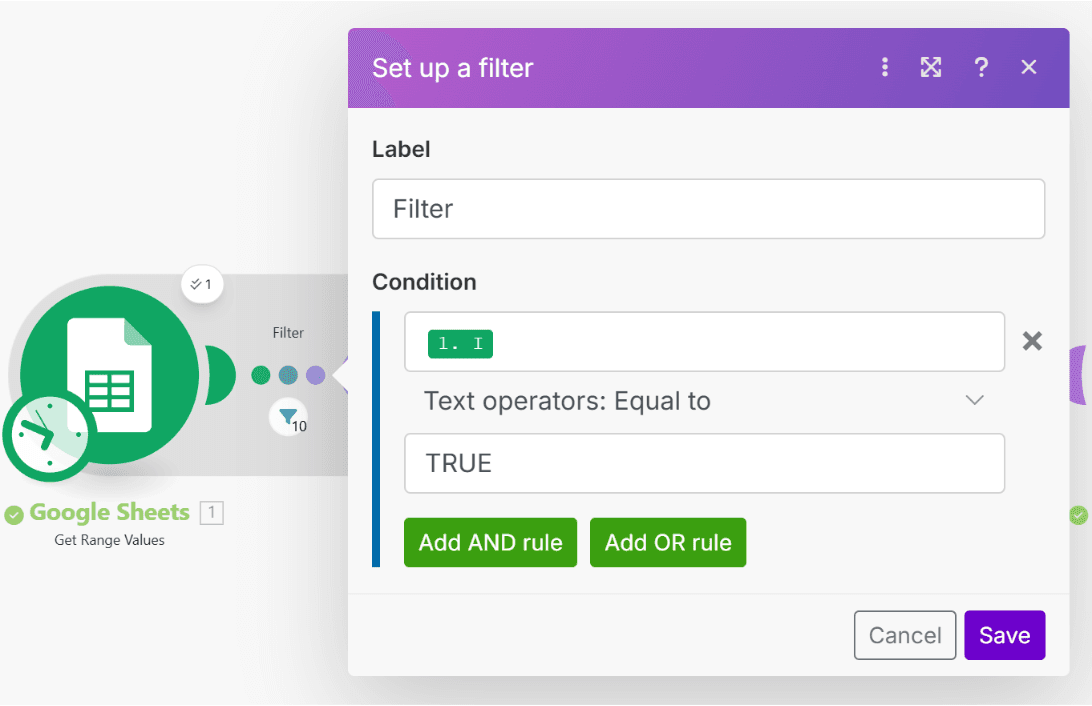
Step 3. Filter & Format Rows
Module: Tools → Set Variable
Filter: Only rows where IncludeInReport = TRUE (column I).
Variable name: Record
Value: Date: {{1.`0`}}, Rep: {{1.`1`}}, Client: {{1.`2`}}, Amount: {{replace(1.`3`; "$"; )}}, Status: {{1.`4`}}, Region: {{1.`5`}}, Plan: {{1.`6`}}
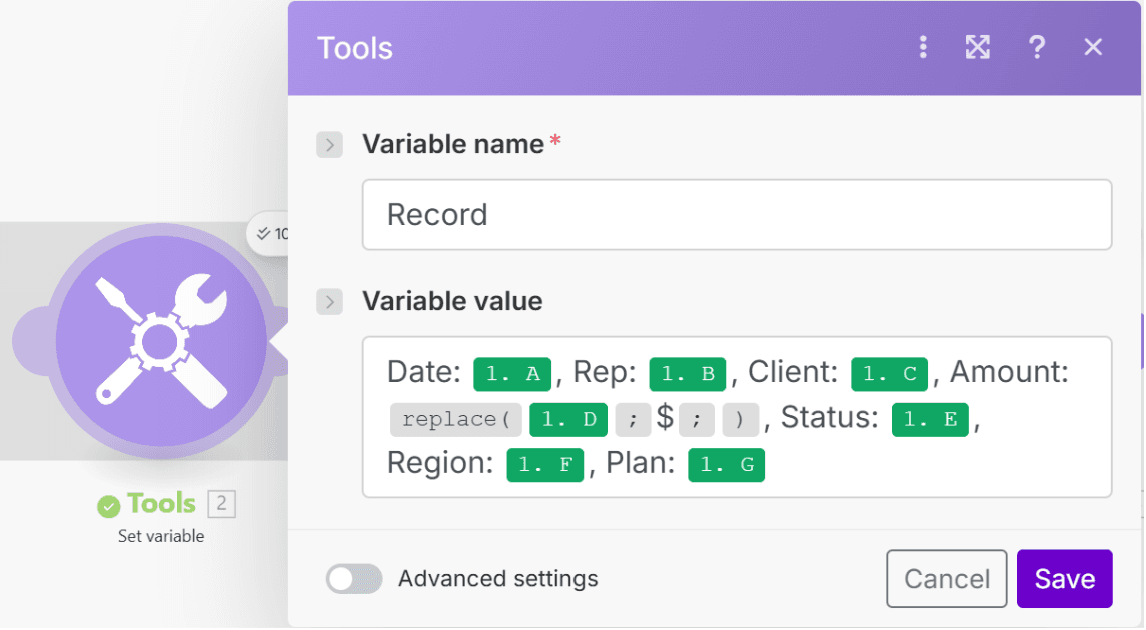
This step ensures only last week’s rows are included, formatted cleanly for the AI.
Step 4. Aggregate the Records
Module: Tools → Text Aggregator
Source Module: Google Sheets - Get Range Values
Row separator: New row
Advanced Settings → Text: {{2.Record}}
Now you have one consolidated text block of all sales records.
Step 5. Generate Report with AI
Module: Make AI Toolkit → Ask anything
Model: Small (GPT OSS 20B) (or compatible AI provider)
Input:
Generate a professional executive sales report in HTML format from the following sales data:
Period: start date to end date
Sales data:
{{3.text}}
The report should include the following sections:
1. Executive Summary — total deals, closed-won count, win rate, pipeline summary.
2. Deal Performance by Region — HTML table with region, deal count, closed-won, win rate.
3. Deal Performance by Plan — same structure as above.
4. Top Performers — HTML table with Rep, Closed-Won, Other Status, and Notes.
5. Pipeline & Risks — bullet points highlighting low close rates.
6. Recommendations — exactly FIVE bullet points with strategic actions based on data patterns (e.g., coaching, focus regions, plan upsell).
Also:
- Use HTML tags only (e.g., <h2>, <table>, <ul>, <li>, <img>).
- Format all tables professionally with borders.
- Include QuickChart bar charts using <img> tags where helpful.
- Output must be complete and self-contained HTML ready to convert to PDF.
When embedding QuickChart images, use URL-encoded JSON inside the <img src=""> tag. The chart URL must be fully valid and renderable in PDF. Use encodeURIComponent formatting to ensure no characters break the link.
Example of correctly formatted chart image tag:
https://www.google.com/search?q=%3Cimg+src%3D%22https%3A...
IMPORTANT:
- Do not use raw curly braces {} in the image src.
- Always encode the chart config for reliable rendering in PDF.
- Continue formatting all other content using standard HTML tags and inline CSS.
Make the output clean, professional, and suitable for C-level executives.
The AI produces a fully styled HTML report with QuickCharts included.
Step 6. Convert HTML to PDF
Module: PDF.co → Convert HTML to PDF
Convert Type: HTML to PDF
Input HTML Code: {{4.answer}}
File name:
Executive_Sales_Report_{{formatDate(setDay(addDays(now; -7); "monday"); "YYYY-MM-DD")}}_to_{{formatDate(addDays(setDay(addDays(now; -7); "monday"); 6); "YYYY-MM-DD")}}.pdf
Orientation: Portrait
Paper size: Letter
Print background: Yes
This produces a polished 2-page PDF report.
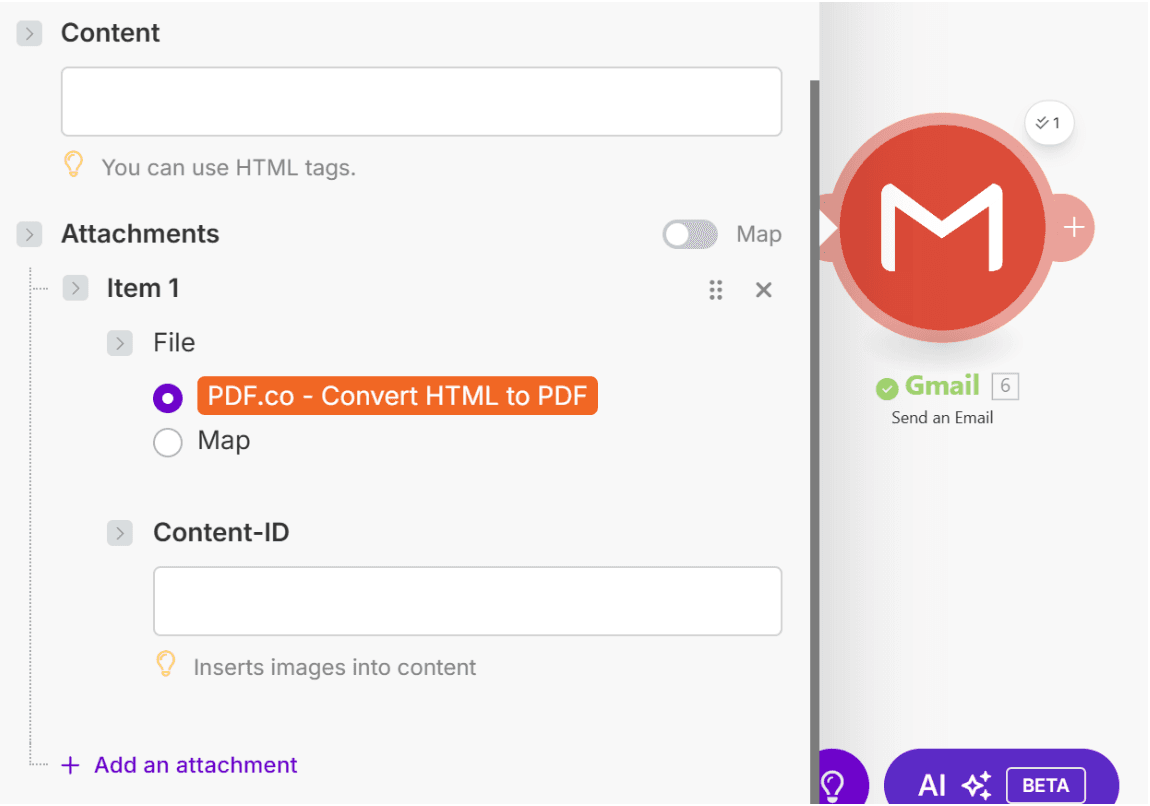
Step 7. Send the Email
Module: Gmail → Send an email
To: Your execs (or distribution list)
Subject:
Executive Sales Report {{formatDate(setDay(addDays(now; -7); "monday"); "YYYY-MM-DD")}} to {{formatDate(addDays(setDay(addDays(now; -7); "monday"); 6); "YYYY-MM-DD")}}
Attachments: PDF.co Convert HTML to PDF
What’s the outcome?
Page 1: Executive summary, KPIs, QuickCharts, tables, and key risks
Page 2: Recommendations plus appendix tables if needed
Inbox: Delivered at 8 AM Monday, ready for decision-making
Conclusion
Whether you're a sales leader, analyst, or agency operator, this workflow gives you a repeatable, scalable way to drive alignment and action without manual effort. It lets you start your week right with an excellent Monday morning advantage.
Ready to make the automation revolution happen?