Jun 2, 2023
How to Measure Active Customers From Stripe Data [Tutorial]
Tired of vague approximations and endless number-crunching sessions? Learn how to measure active customers from Stripe data.

Among the things keeping startup CEOs up at night, there’s a particularly terrifying one: Not knowing the number of active users their company has.
Understanding the pulse of a business has become an art unto itself, but in the context of slow economic growth and rising interest rates, there’s no time to master it.
You either solve the problem or assume the risk of leaving it unattended.
If you’re growing tired of vague approximations and endless number-crunching sessions, get a Make account and get ready. In this tutorial, we’ll show you how to measure active customers from Stripe data.
And in less than an hour, you’ll be looking at your very own automated system to measure active customers once and for all.
Ready to slam-dunk the real number whenever the question comes up? Then let’s not waste another minute!
Step 1: Create a Google Sheets spreadsheet
The first thing you’ll need to gather the data on a regular and automated basis is a Google spreadsheet.
Your sheet must have columns for:
Date
Number of customers
Percentage Increase/Decrease from the previous month
As you can tell, this solution will also show you how many customers you’ve won or lost compared to the previous measurement.
Step 2: Create a Make scenario and add the Stripe app
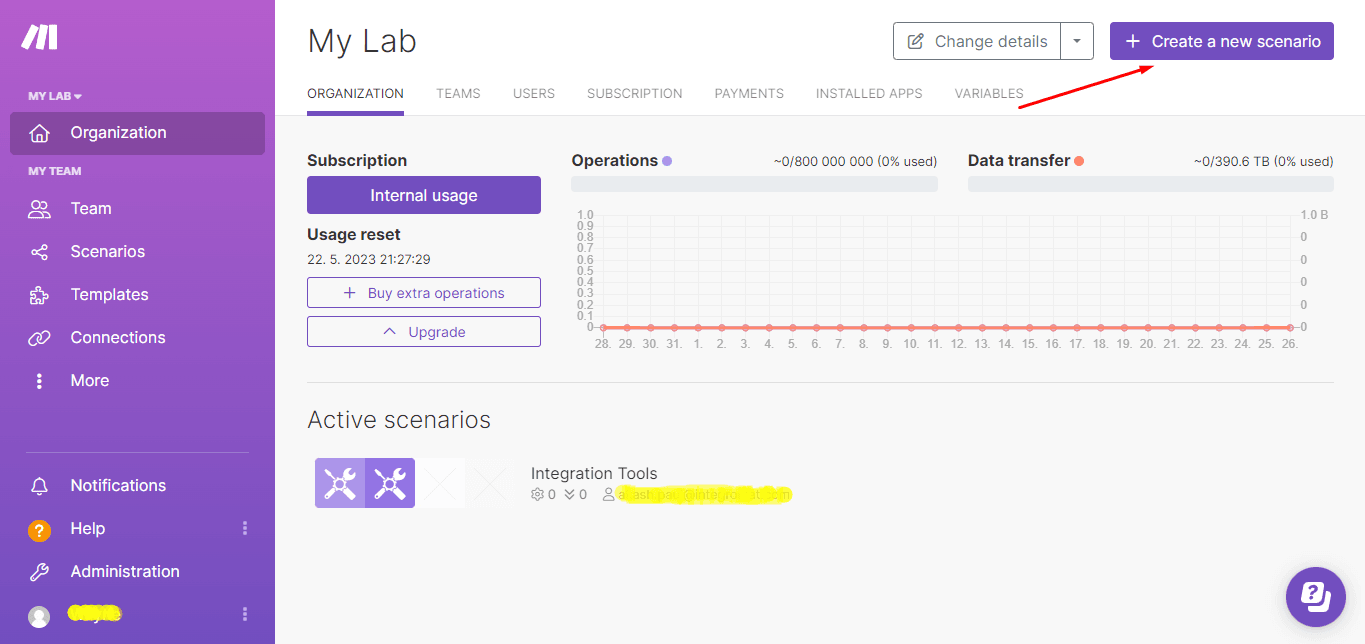
Next, log in to your Make account and navigate to the scenario builder to create a new scenario.
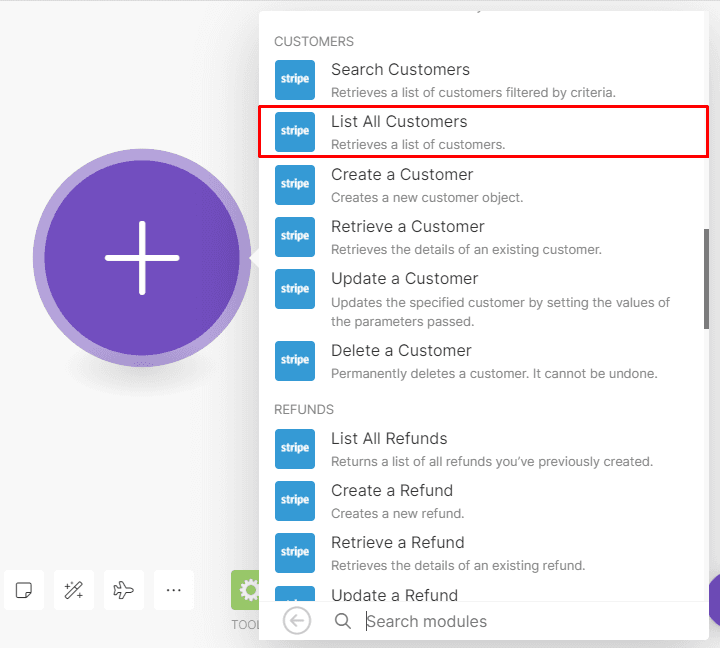
In the scenario builder (aka visual canvas), search for the Stripe app and select the Stripe - List All Customers module.
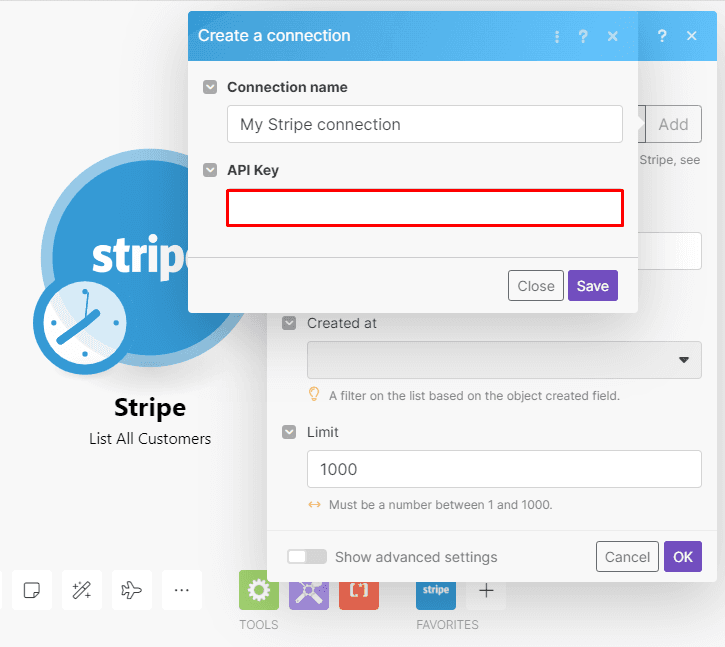
Before configuring the module, you need to connect your Stripe account to Make by entering your Stripe API key.
Then, increase the Limit to a high number, since this is the number of customers that the module will fetch each time the scenario executes.
This is all you need to do in order to configure this module. Once done, hit OK.
Step 3: Add the Google Sheets app to your scenario
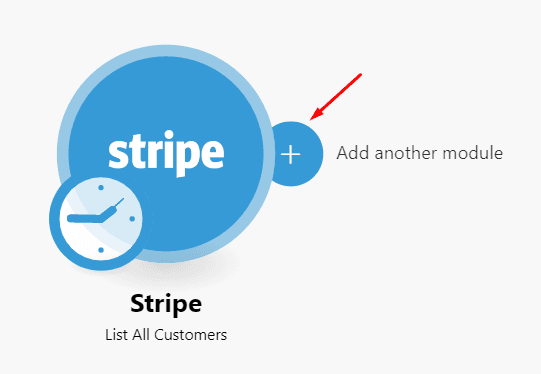
Next, you need to add the Google Sheets app by clicking the Add another module button.
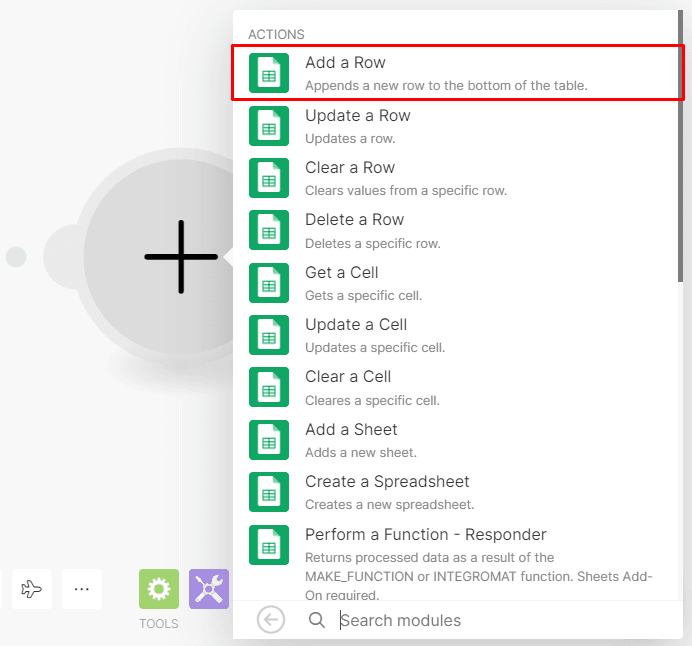
You want to add the data to your recently created Google Sheets spreadsheet and to do this we’ll select the Google Sheets - Add a Row module.
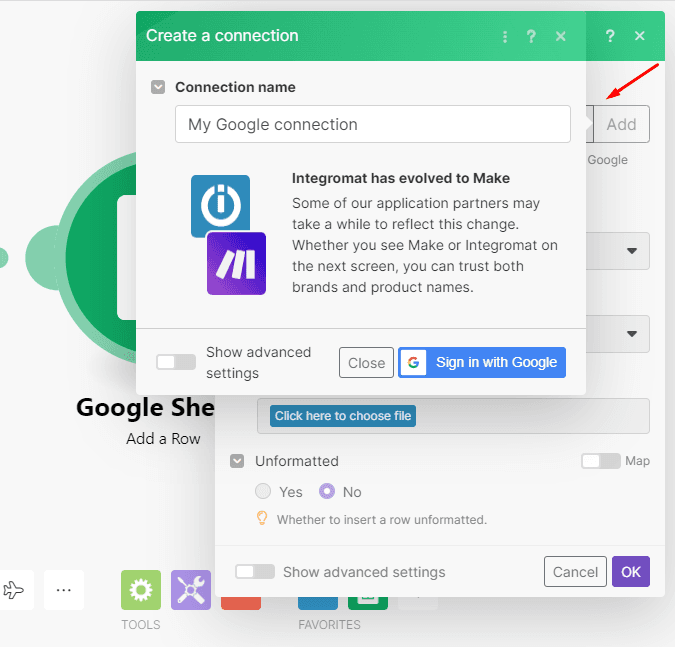
As you probably realized, your Google account needs to be connected to Make to proceed.
Click the Add button and follow the prompts.
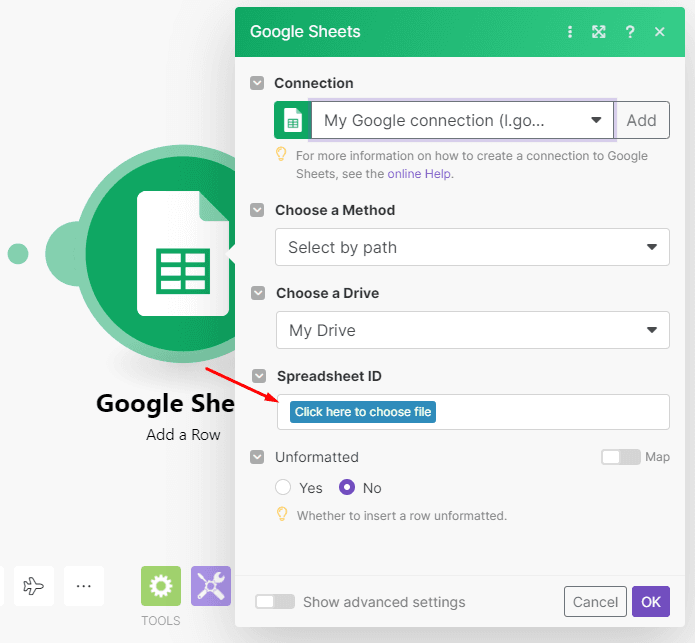
After connecting Google to Make, choose the Select by path option.
Then select the Google Drive where the spreadsheet is, and then the spreadsheet that you want to add the data to followed by the sheet itself.
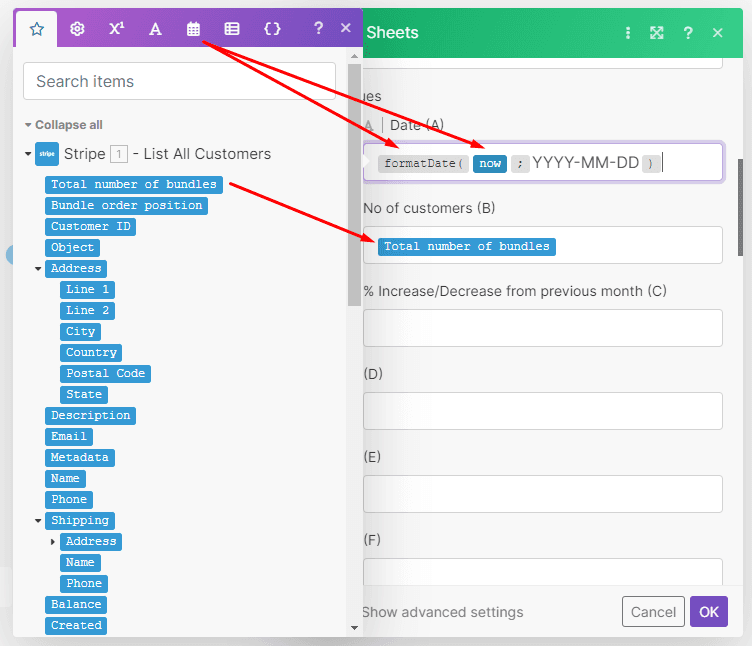
You’ll notice that the spreadsheet cells are now visible and ready to map. The first field is Date, you can change the format of the date as you see here by using the formatDate (located in the functions tab) and the now variable followed by the format you want (see screenshot below for reference).
The Total number of bundles data item represents the total number of customers.
In the Number of customers field, simply map the Total number of bundles data item as shown in the image below.
Once done, click OK.
Step 4: Add a filter between the first two modules
Since there will be many customers resulting in bundles of data (hopefully), this will result in every bundle of data being added to the sheet as new rows - but we just want the total on a single row.
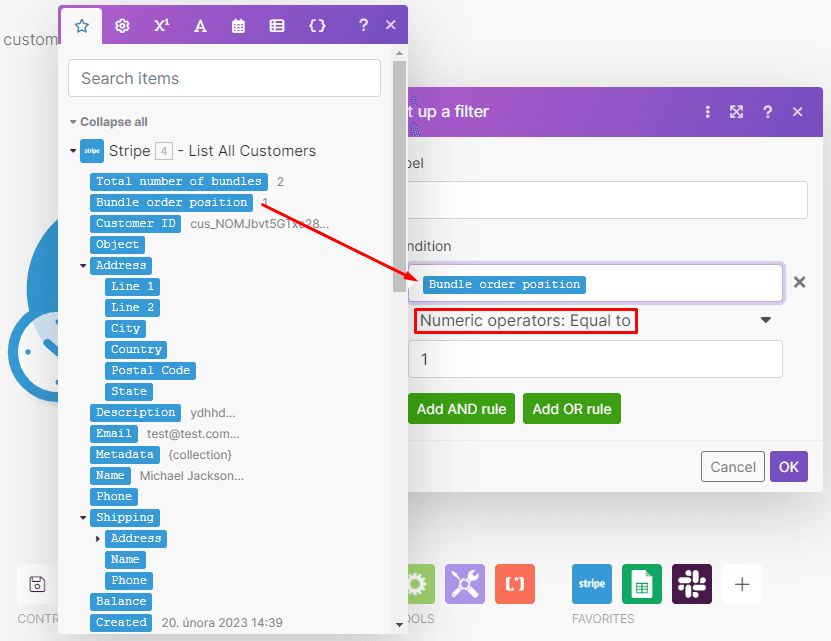
The solution to this problem is to use a filter so that only one bundle passes through and one row of data is added to the sheet (as required).
Notice the link between the two modules? Click on it to open the filter menu.
Since you want to allow one bundle of data to pass through, configure the filter as follows:
Map the Bundle order position item to the top field
Select the Numeric operators: Equal to operator
Enter 1 in the bottom field so that only the first bundle passes through
Then, hit OK and move to the next step.
Step 5: Add the second Google Sheets module
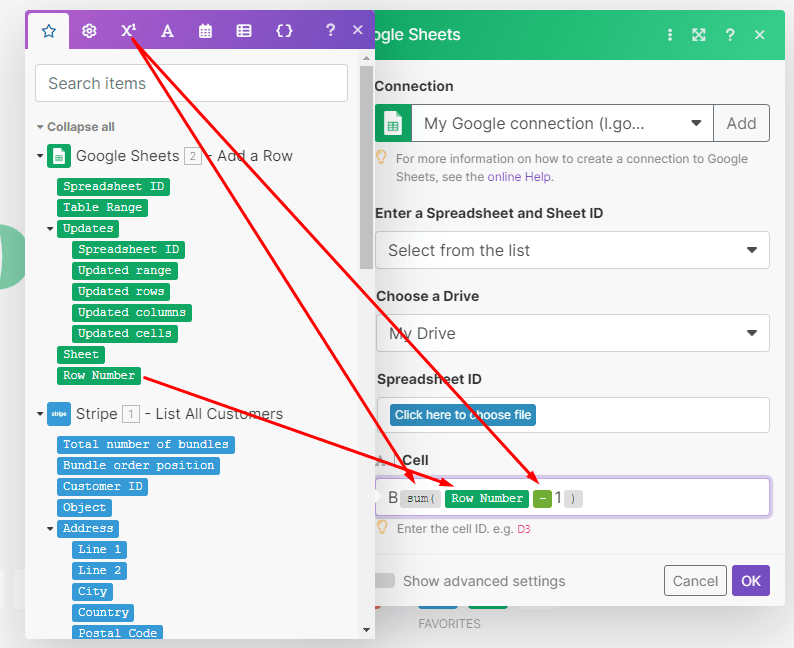
The next step is to get the previous month’s total number of customers from column B so we can calculate the percentage increase/decrease in the subsequent module.
Add the Google Sheets - Get a Row module to the scenario, select your spreadsheet (like you did before), and simply use the following formula to retrieve this information.
All good? Then hit OK to finish configuring this module.
Step 6: Add the third Google Sheets module
In this step, we’ll automatically calculate the percentage increase/decrease in the total number of users your company or product has.
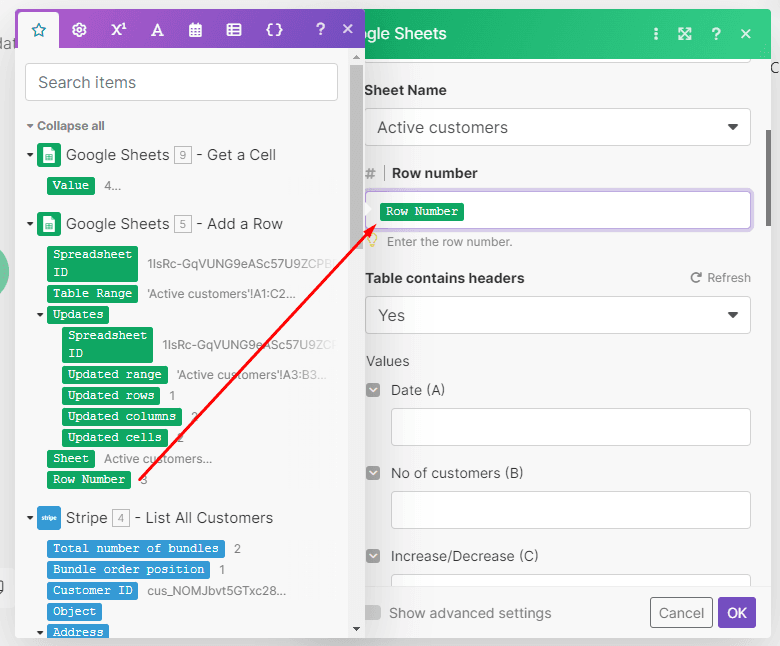
To do this, add the Google Sheets - Update a Row module to your scenario.
First, you need to map the Row Number from the Add a Row module to the Row number field.
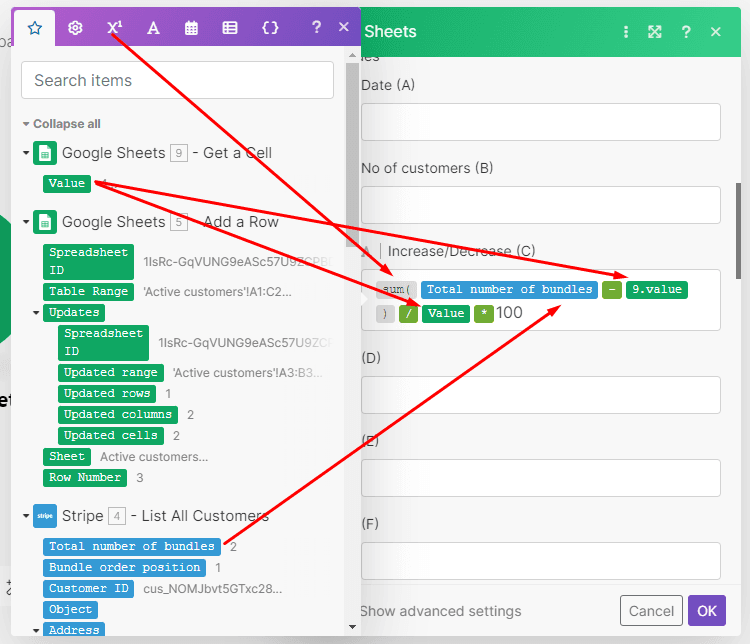
To calculate the percentage increase/decrease, use the following formula in the corresponding field.
{{sum(total number of bundles - value) / value * 100}}
Here’s what it looks like when entered into the module:
Ready? There’s one more module to configure and we’ll be done.
Step 7: Add the Slack module
The final step is to send a notification to the person or team that requires the information.
We’re using Slack to do this but Make supports multiple team communication platforms in case you need to change it (such as Microsoft Teams,
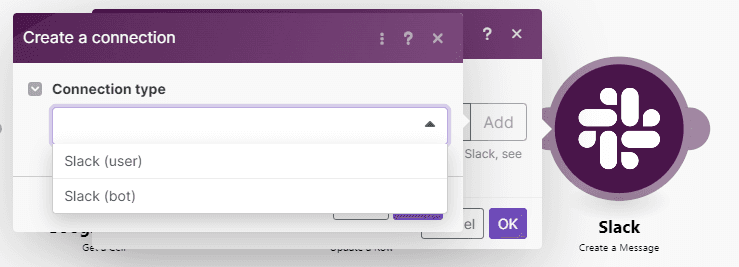
Back to the scenario. Add the Slack - Create a Message module and connect your Slack account to Make by choosing the option of User or Bot as the connection type.
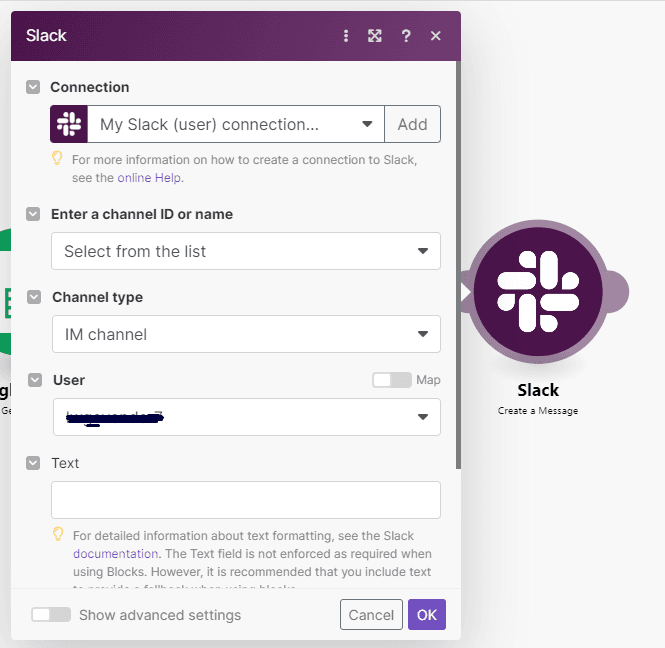
Once you establish the connection with Make, configure it as follows:
Choose the Select from the List option
Select the Channel Type
Select the User/Channel that you want to send the notification to
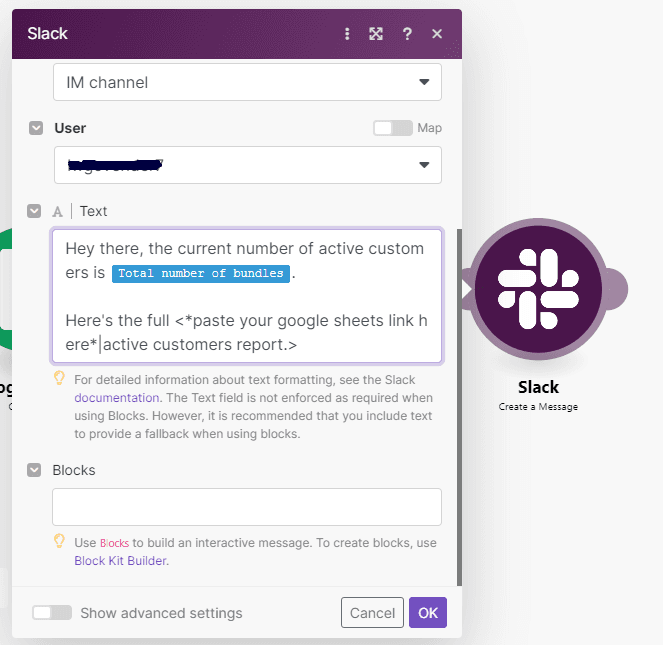
Now you’ll have to write the message that will accompany the information (i.e. number of users plus percentage variation).
Here’s a sample of the text used to compose the message. You can enter any details and map any data you want from other modules - and even send a link to the sheet itself if you want to!
Once ready, hit OK. It’s time to test this automated scenario and see if it works as intended.
Step 8: Test and activate the scenario
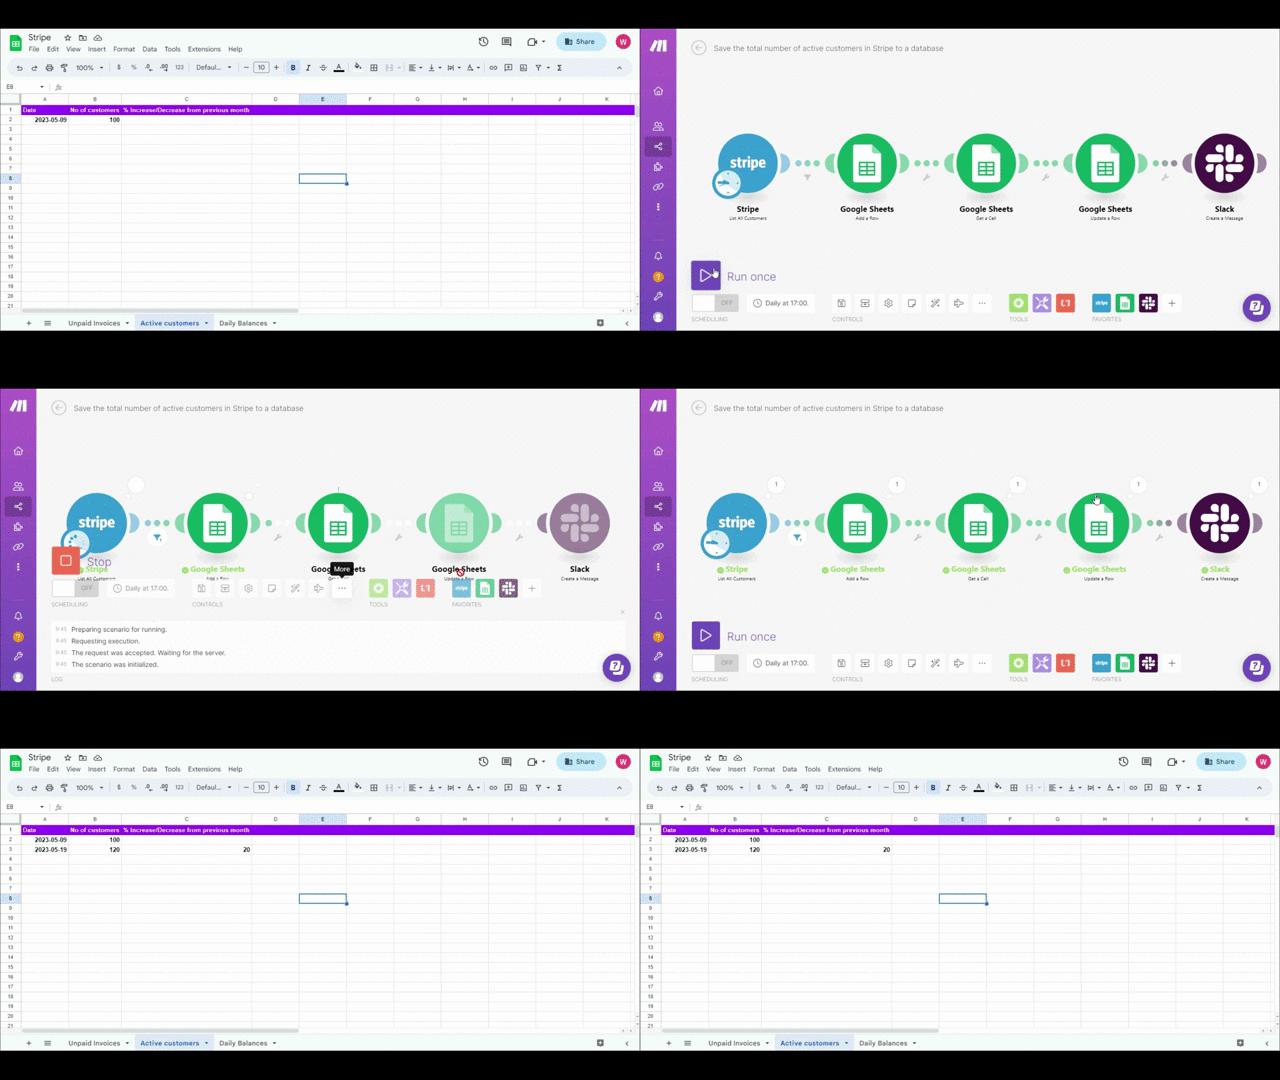
Let’s take a look at what the scenario execution looks like.
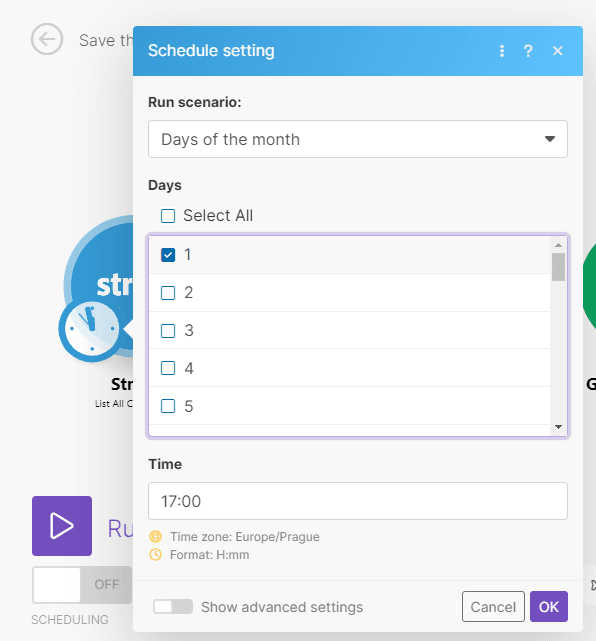
Seeing it perform the task of retrieving the data as expected, you can now set the scenario to execute on a custom schedule.
In this demo we want it to execute on the first day of every month, so we can count on fresh data and draw plans upon it.
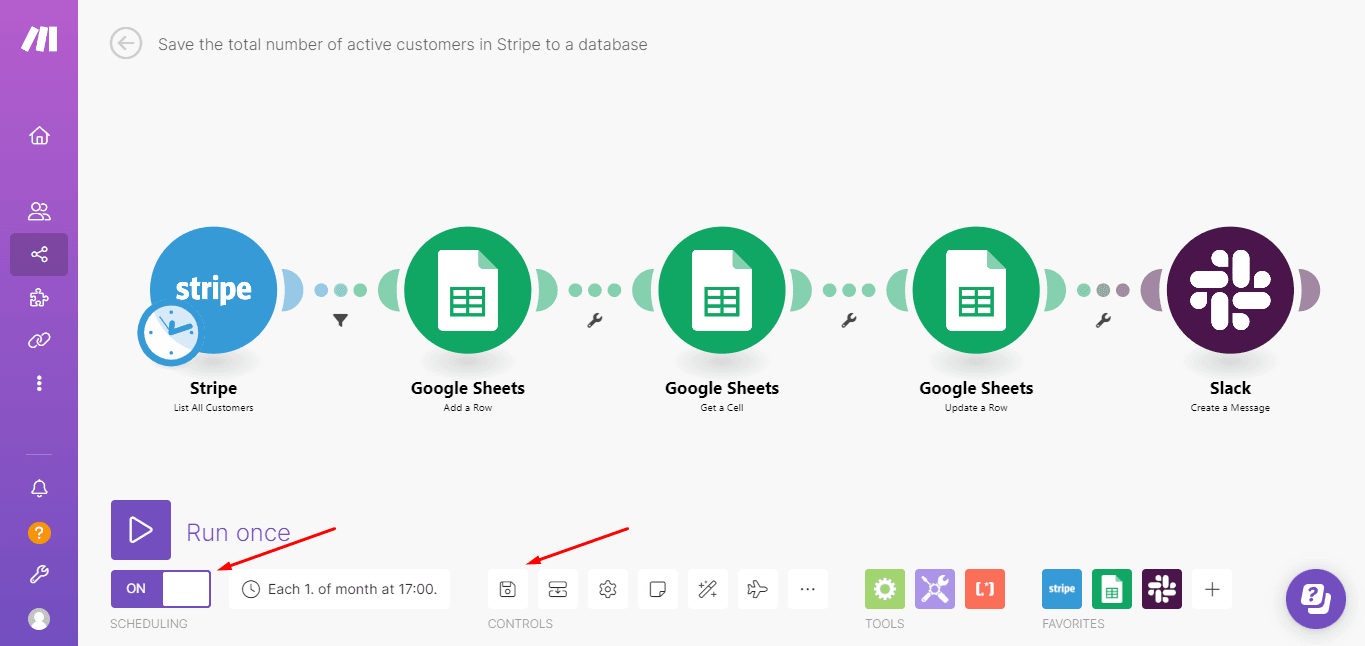
And lastly, save the scenario and switch it on.
And this is how you measure the number of active customers based on payment data from Stripe.
Final thoughts: Business fundamentals using real-world data
If you looked closely, you might have noticed that this Make-powered automation solves more than the original problem of measuring the active customers your company has.
On top of providing this data, it does so in a way that’s easy to understand, requires minimal resources, and automatically communicates the results to the stakeholders that need to know.
It is in the simplicity where the beauty of the solution resides.
You won’t have to hunt for developers, splurge on consultants, or wrap your head around complicated concepts.
All it takes is an hour of your time, a strong desire to know what the actual numbers look like, and a Make account!
Ready to make the automation revolution happen?


