Aug 27, 2021 | 9 minutes
How to Track SaaS Subscriptions to Reduce Churn [Tutorial]
Learn how to create a churn management solution that identifies cancelled subscriptions so you can deploy winback programs and reduce churn on the spot.

Few words spark more concern among growth managers and startup founders than “churn”.
For every subscription-based business, there is at least one person looking at churn rates with devotional attention - hoping for the best, and also (though not always) preparing for the worst.
But what is churn?
In its broadest acceptance, the word churn refers to “churn rate”, which is obtained by dividing the number of customers who cancel their subscription to a service over the total number of customers, all within a defined period of time.
In simple terms, churn is a measure of the people cancelling a subscription during a specific period. Such service can be anything from a phone contract to a SaaS product that you no longer need, and the period can be measured in months, quarters, and so on.
In addition, churn is one of the metrics that defines the lifetime value (LTV) of a customer. Since this figure is key to predicting the success of a company and its business model, following churn rates from close distance makes sense.
The problem, naturally, comes with high churn rates.
When this happens, entire teams scramble to meet three goals:
Identify the customers who are cancelling their subscriptions
Analyze the reasons for churn
Reduce customer churn
There are plenty of unique reasons for churn, and just as many solutions to reduce it.
Singling out those who cancel their subscription, however, is more straightforward.
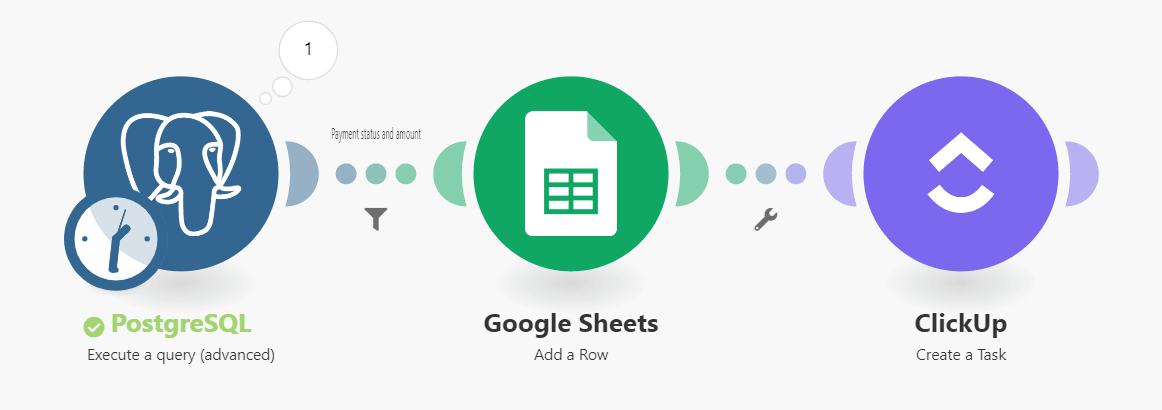
In this use case, we will show you how to identify churn by:
Analyzing payment data from a database
Sending the cancelled subscribers to a Google Sheets spreadsheet
Creating a task in a project management tool for each subscriber that left
This way, you will be able to set the groundwork required to win former customers back.
Ready? Let’s not waste another minute then.
Scenario summary: Building a SaaS subscription management tool
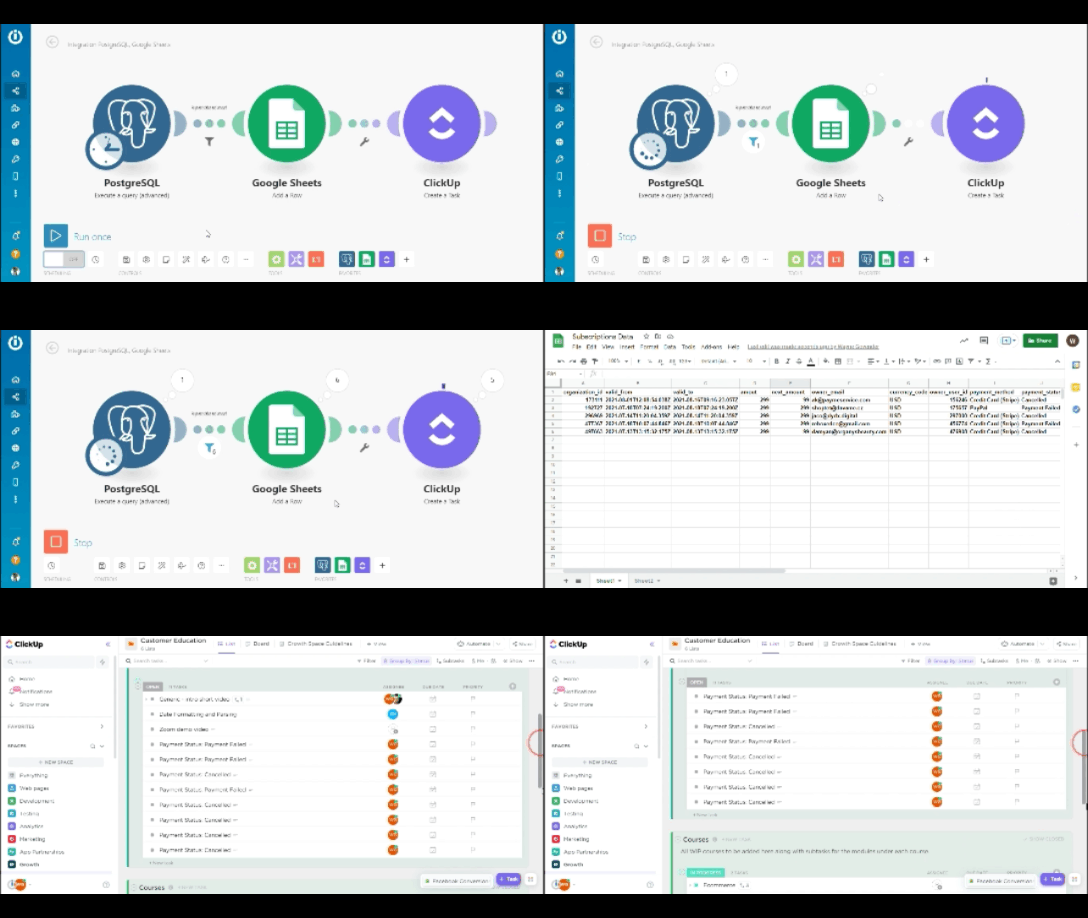
The scenario we will create analyzes credit/debit card payments made to a subscription-based service, singles out the customers who cancelled the subscription, and creates a task on a project management tool for each cancelled subscription.
This way, you’ll be able to create custom winback programs and set them in motion the minute a subscriber leaves your service.
Before we start, you will need the following:
An Make account
Access credentials for a PostgreSQL database (where the payment data is stored; it’s assumed that the database already exists)
A Google account
A project management tool account (we are using ClickUp in this example)
To conclude, our scenario runs on a monthly basis. This means that Make will fetch all the payments made in this date range, pick the ones with “Cancelled” or “Payment failed” status, and create tasks on ClickUp for each of those.
Needless to say, you can tweak the scenario to suit your needs. For example, if you use Asana instead of ClickUp, you can replace the latter with the former.
Now, let’s take a look at how to create this.
Step 1: Creating the Make scenario and adding the PostgreSQL app
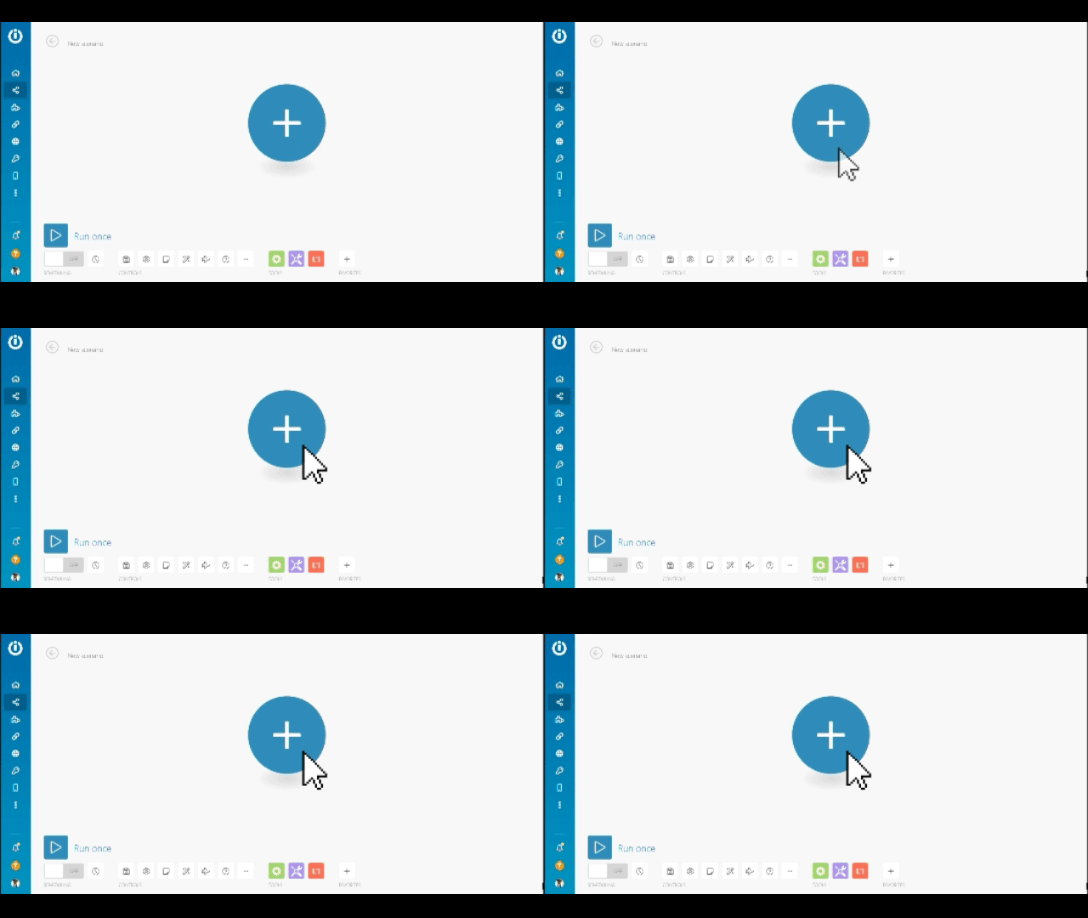
From your Make dashboard, click on the “Create a scenario” button on the top right corner of your screen.
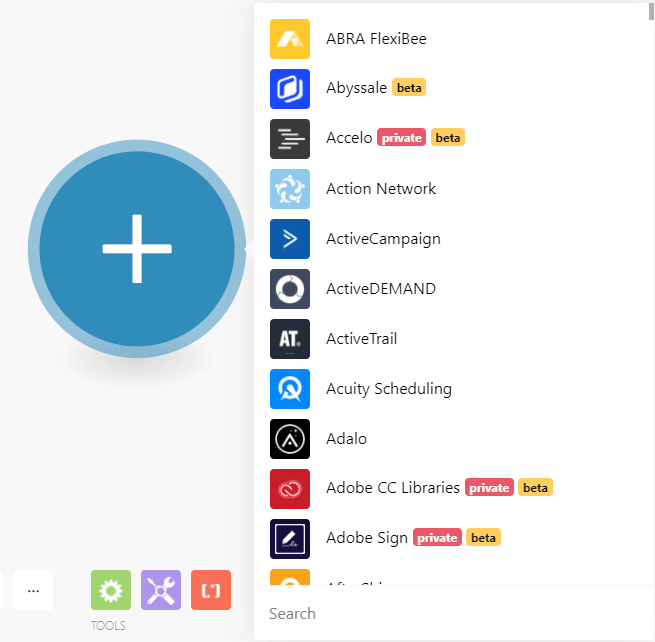
After doing this, you will land on the scenario builder. Here, click on the blue circle, which will bring up the list of available apps on Make.
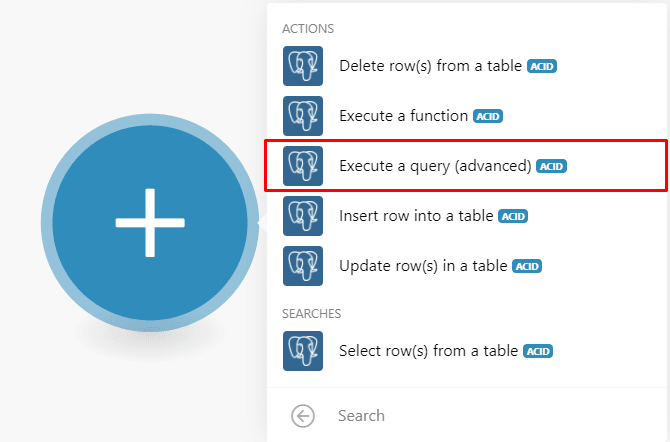
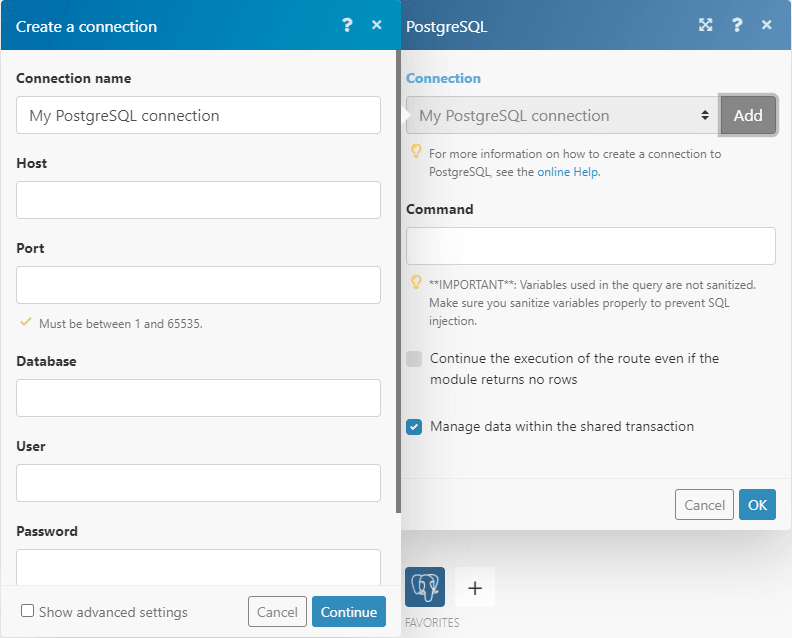
Once there, search for the PostgreSQL app, and select the “PostgreSQL > Execute a query (Advanced)” module.
The next step is to connect your PostgreSQL account to Make.
The administrator of the PostgreSQL account will be able to provide you with the credentials needed to add the connection.
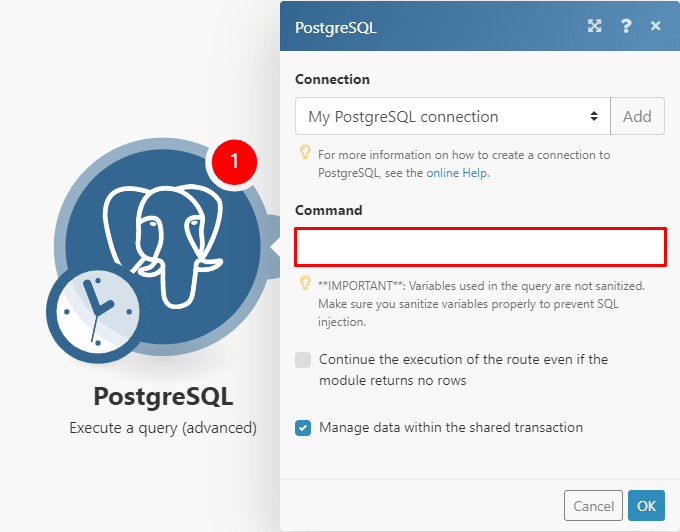
In your PostgreSQL database, there will be a table containing all the data that you’re looking for. You’ll be able to access this table by using a special command in the PostgreSQL module that you just added.
Understandably, your table will likely feature different fields and data than the table used in this tutorial.
Our table has the following fields: .
Table name - Subscriptions
Organization_id
Valid_from
Valid_to
Amount
Next_amount
Owner_email
Currency_code
Owner_user_id
Payment_method
Payment_status
Payment_created_at
Row_added
We recommend you replace the fields/data in the text with the corresponding fields/data in your table as you create this scenario.
Getting back to the PostgreSQL module, you need to add a command that will retrieve the details of all created payments for a specific date range.
In this example, this range will be one calendar month. Eg. 1st July to 1st August.
Manually entering the dates in the command will result in data for those dates being called every time the scenario executes.
Therefore the date range will need to be determined dynamically in the command.
Here’s how to do that.
In the command, the payment_created_at data from the table (which contains all the dates for every payment on the table) is retrieved.
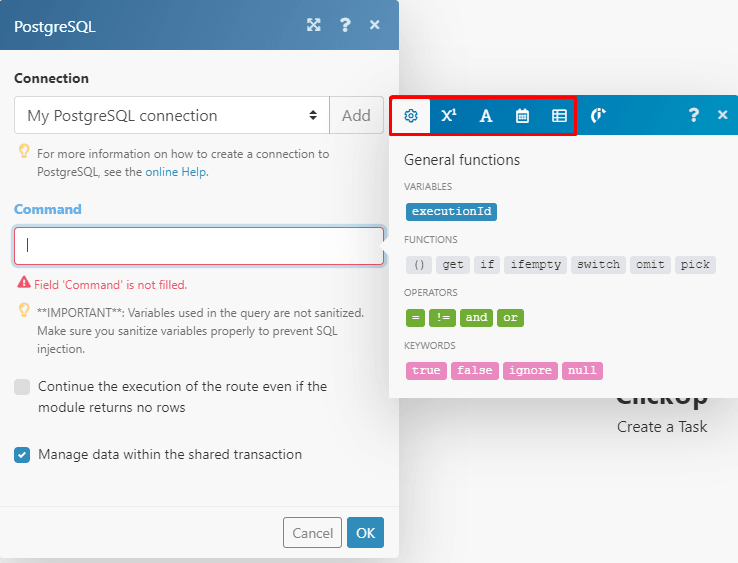
Since you only require payments from a specific date range, these dates can be extracted from the above data by using Make’s built-in functions, which you can find by clicking in any field.
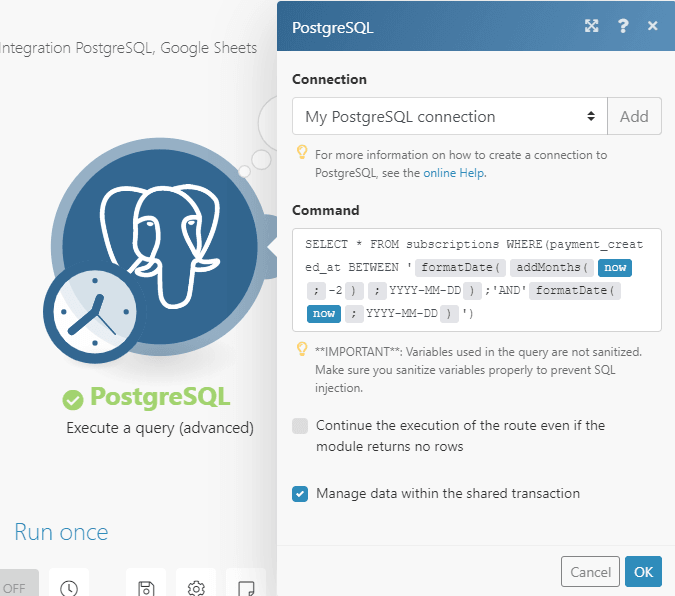
Let’s first take a look at what the command looks like in the module to get a clear visual and then we’ll break it down.
As you can see, the “addMonths” and “formatDate” functions are combined with the “now” variable to create the command.
Let’s take a second to explain the purpose of these:
now variable - Outputs the current date and time
addMonths - Used to change the current month that the now variable outputs to the previous month for the start of the range
formatDate - Changes the date to YYYY-MM-DD and removes the time outputted by the now variable
Now that you have the correct months for the range, the days of the range depends on when you set your scenario to execute.
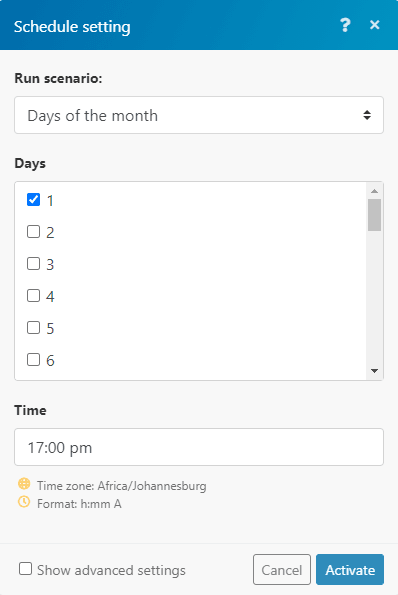
As mentioned earlier, the range will be from the 1st to the 1st, so the scenario must execute on the first day of every month.
We’ll show you how to set this up later on.
Below is the command that you can copy and paste into your module:
SELECT * FROM subscriptions WHERE(payment_created_at BETWEEN '{{formatDate(addMonths(now; -1); "YYYY-MM-DD")}};'AND'{{formatDate(now; "YYYY-MM-DD")}}')
Simply replace “subscriptions” with the name of your table, and “payment_create_at” with the field in your table that contains the same data.
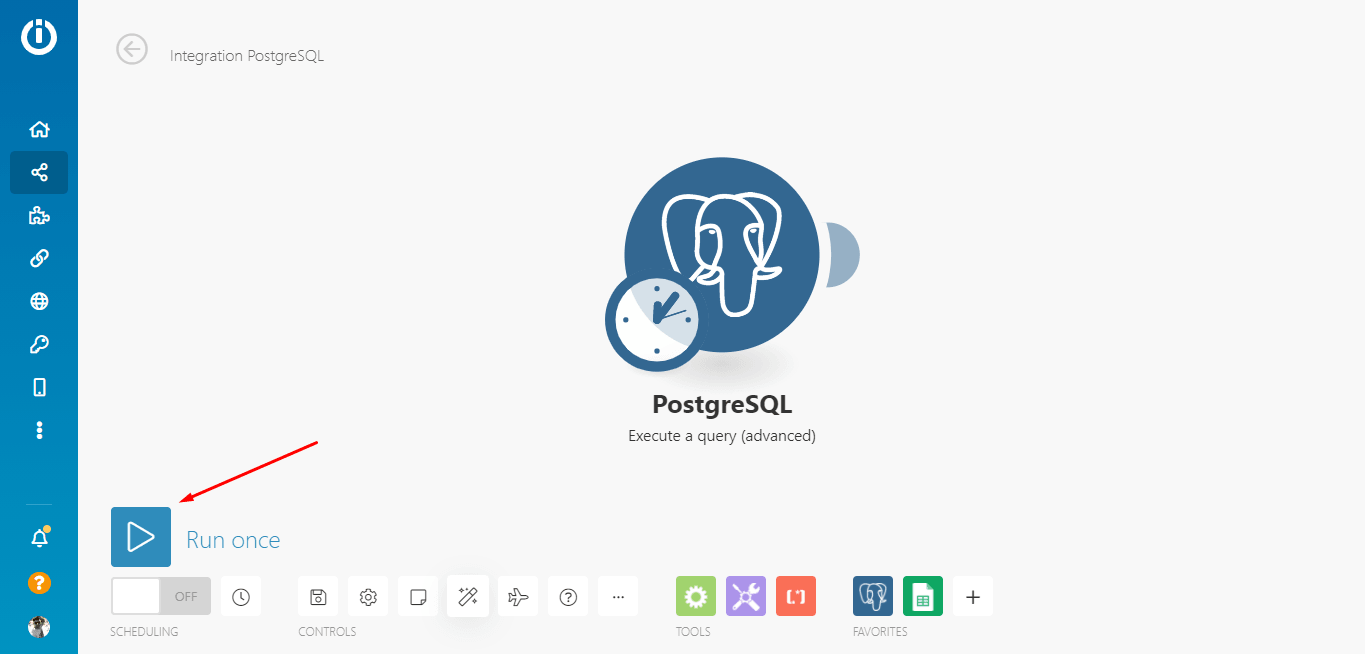
Once you configure the module, execute the scenario by clicking the “Run once” button to retrieve some data.
You’ll need to do this to map the data in the next step.
If the module doesn’t output any data, you may need to adjust the date range in the command.
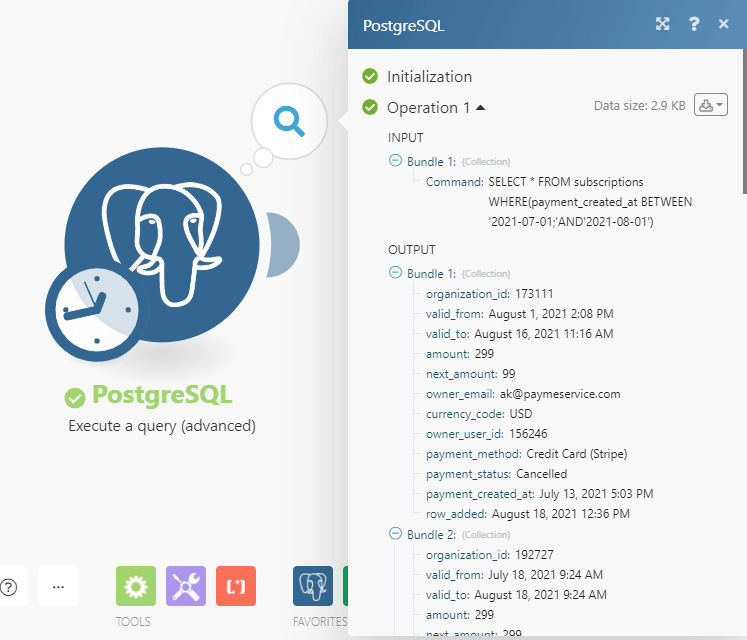
The output should look like this:
Now, let’s move into the next step of this automation.
Step 2: Adding the Google Sheets app
Once the “PostgreSQL” module is configured, the next step is to add the resulting data to a Google Sheets spreadsheet.
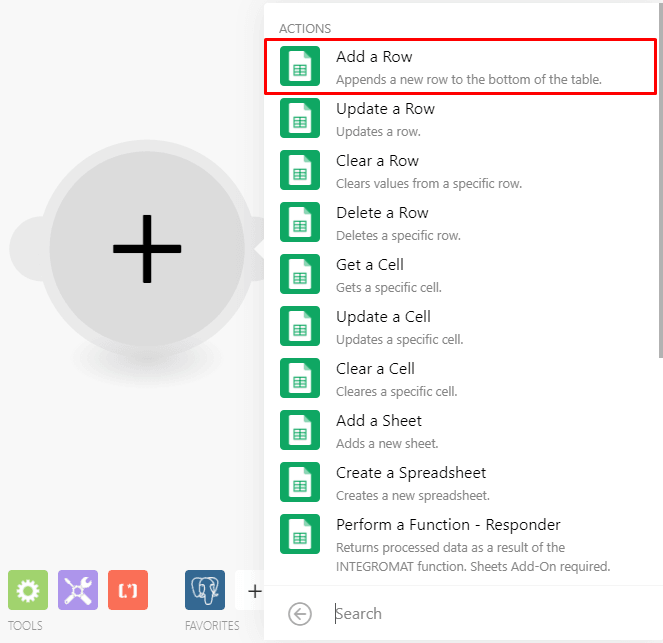
In your Make scenario, click the little plus sign next to the “PostgreSQL” module to add another module.
Then, search for the Google Sheets app. From the list of modules that pop up, select the “Add a row” module.
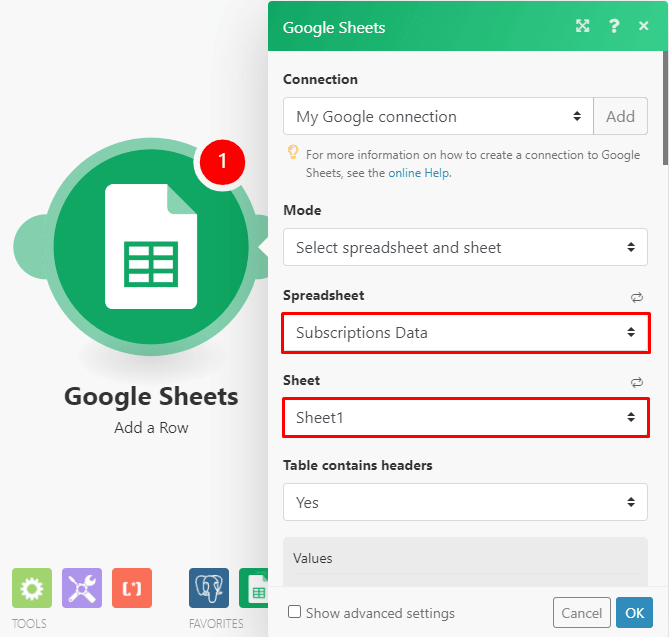
In the module’s configuration box, add a connection to your Google account. Once connected, you can select the spreadsheet and sheet that you want to use.
Make sure you create these before configuring the module, or they won’t show on the list of available options!
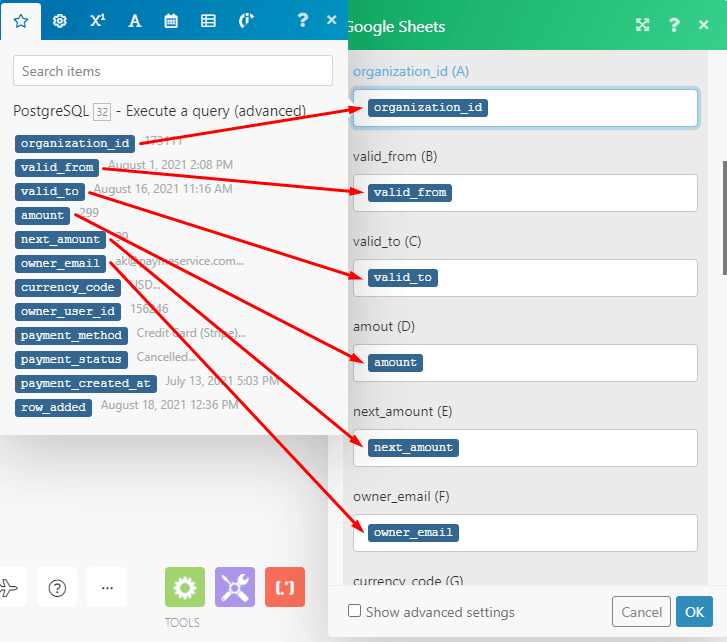
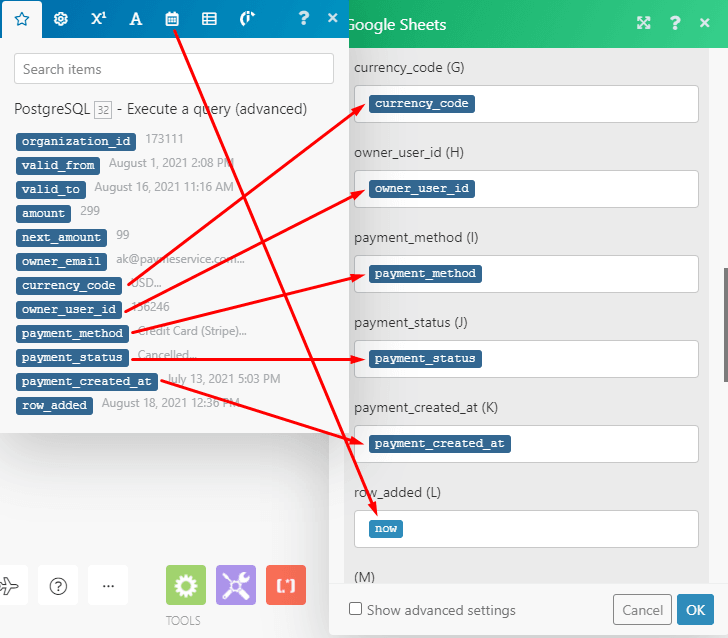
Next, scroll down to see the fields in your sheet.
Here, you have to map the data outputted by the “PostgreSQL” module to the corresponding fields, as you can see below.
Once you are done mapping the values, click the “OK” button.
This will allow you to automatically move data from the PostgreSQL database to your sheet.
Since we only need details of cancelled and failed payments, we will need to add a filter to the scenario. Let’s see how to do it.
Step 3: Adding filters in the scenario
Let’s turn our attention to the “PostgreSQL” module again.
As you know, the command fetches the details of payments that fall within a given date range, so the next task is to extract payments from this date range that meet the following criteria:
Cancelled or Payment Failed statuses with amounts of $299 or more.
Only the payments that fall in this category will be added to the sheet.
By using a filter, we can prevent payments with any other status and amount combinations from being passed through to the Google Sheets module.
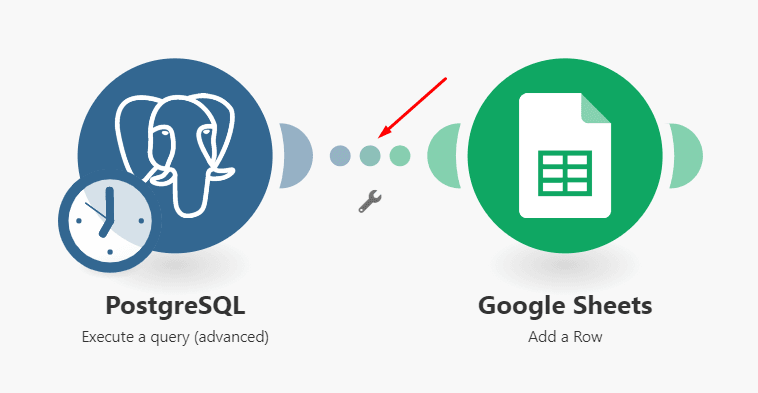
To add a filter, click on the link between the two modules.
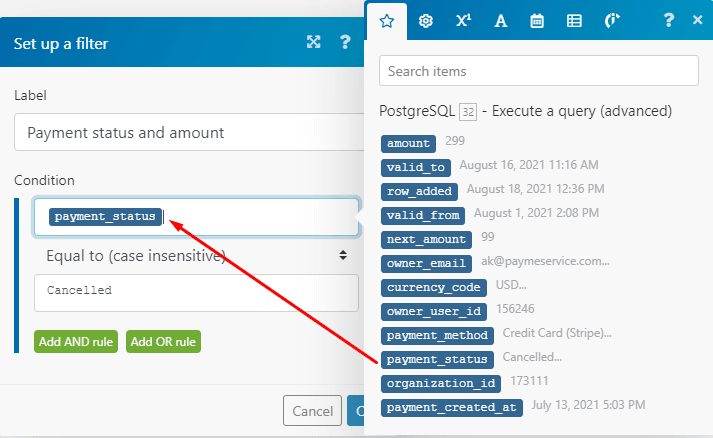
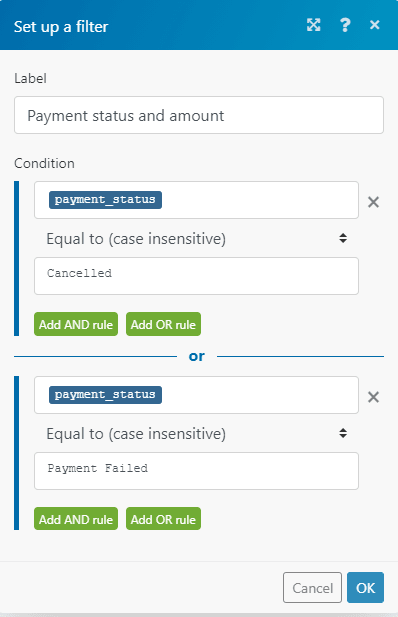
In the filter settings, give your filter a name, and then add the first condition by:
Mapping the payment_status data element to the top field
Selecting the Equal to (case insensitive) text operator
Entering Cancelled in the bottom field
Since the payment status we are after can be Cancelled or Payment Failed, click the “Add OR rule” and and set the condition just like you did before, but this time enter Payment Failed in the bottom field.
See the image below for reference:
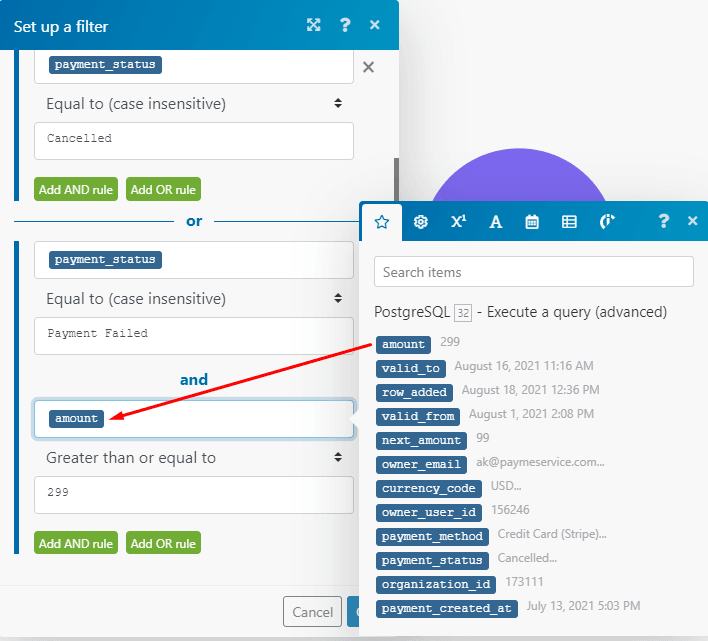
Either of these payment statuses must also have an amount of $299 or more to meet the criteria. Therefore you need to use the “Add AND rule” here.
Once you add it to the filter, map the amount data element to the top field, select the Greater than or equal to numeric operator, and enter the amount in the bottom field like you see below:
After doing this, click “OK”.
You now have a filter that will only allow payments that meet the criteria to pass through and get added to the spreadsheet.
Now let’s add the final module to the scenario.
Step 4: Adding the ClickUp app
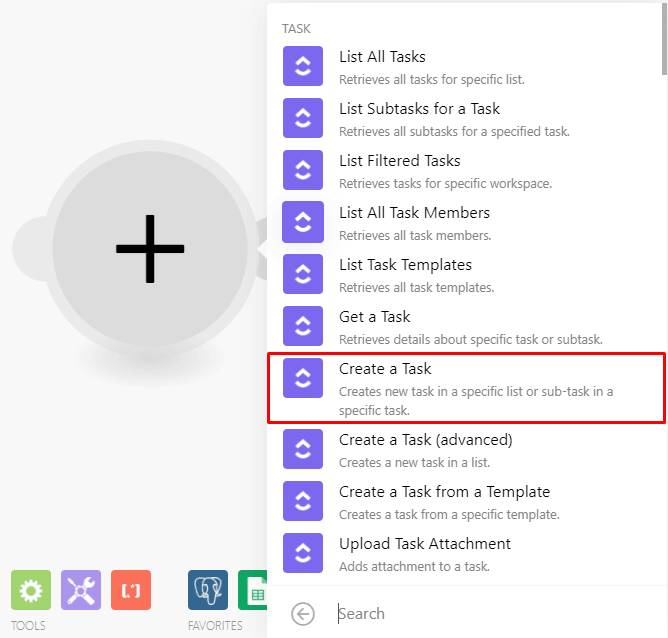
In a similar manner than you did before, add the ClickUp app and select the “Create a task” module from the options.
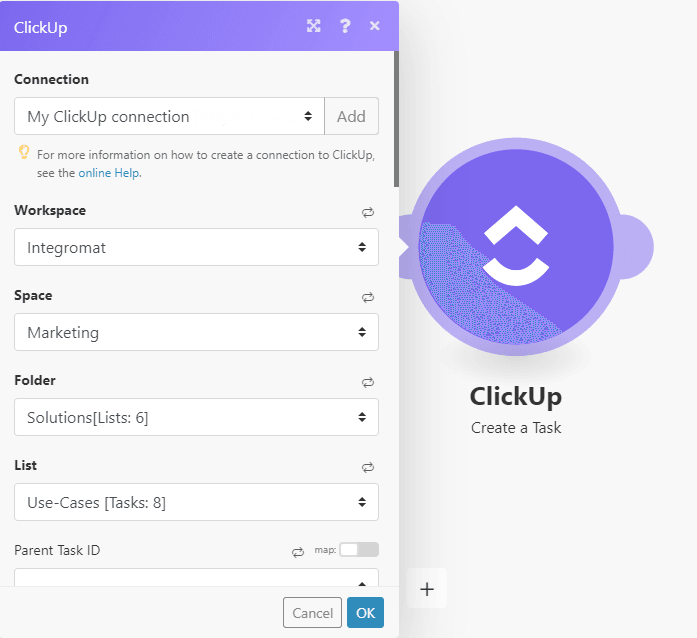
Once you connect your ClickUp account to Make, you can then select the following in the module:
Workspace
Space
Folder
List
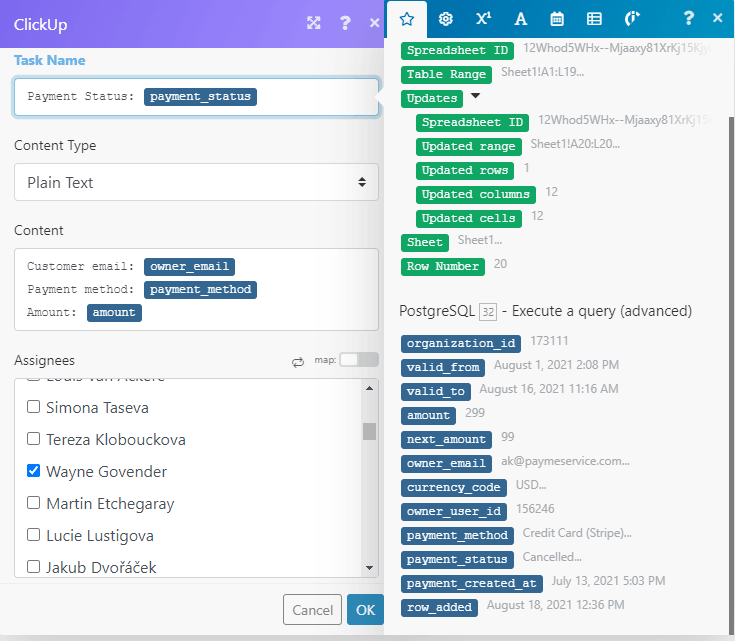
When you scroll down, you have the option to enter the task name, content and select the assignee or assignees.
You can map any of the data from the previous two modules to compose the name and content of the tasks containing the cancelled subscriptions.
See the example below for reference:
After you do this, click “OK”, and this module will now be fully configured. It’s time to check if this scenario is working as expected.
Step 5: Testing the scenario
Again, hit the “Run once” button in the scenario builder to kick off the automation.
If you have payments that fall within the date range and meet the filter’s criteria, they will be added to the spreadsheet and the ClickUp tasks will be created as well.
Working well? Good!
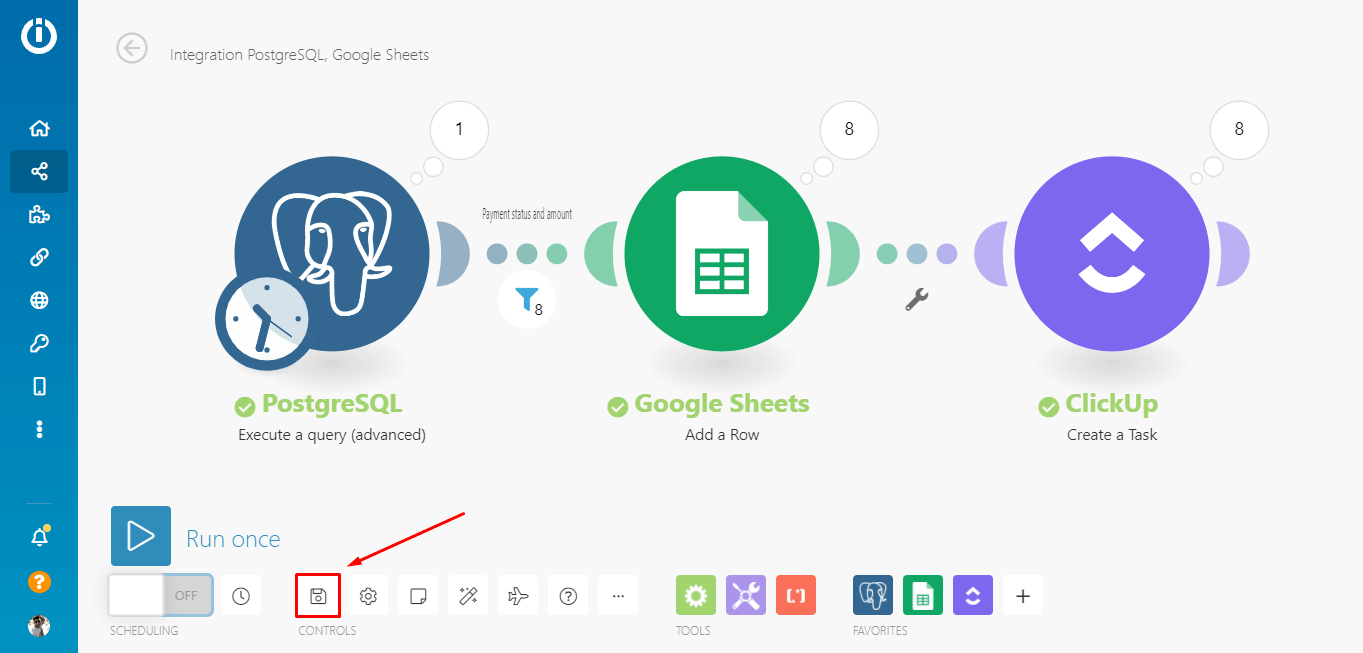
Save the scenario by hitting the “Save” button at the bottom of the builder.
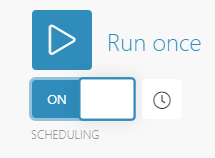
Lastly, toggle the schedule switch which lies below the “Run once” button.
This will bring up the schedule settings box, where you can set the scenario to execute automatically whenever you want it to.
Once set, hit the “Activate” button, and you’ll be all done.
Conclusion
Once you have this scenario running on the background, you will be able to create strategies to reduce customer churn on the spot.
Make will do the heavy lifting for you by identifying the cancelled subscriptions, and creating tasks that you can assign to those in charge of designing the winback programs.
Does this SaaS subscription management solution require a bit of work? Sure! But once you deploy it, you’ll never need to look back for this type of data again.
Happy automating!

Wayne Govender
Solutions Architect at Make who loves all things tech with a focus on workflow automation. Also enjoys fitness and spending too much time on YouTube.

