Jan 6, 2025 | 3 minutes
Track, analyze, and improve - the new Analytics Dashboard
Make empowers both the technically savvy and the technically interested to create and manage workflows, fostering democratized ownership across teams and departments. However, this increased accessibility also introduces challenges related to usage, error visibility, and governance - especially as automation efforts grow.
As you develop more and more scenarios to power your business, it can become more challenging to stay on top of what’s happening across your Make account.
As a result, observability - providing clear insight into how workflows are utilized and perform over time - is essential to maintaining the full value of no-code automation as you scale. What’s more, observability and governance go hand in hand. By tracking and monitoring platform usage, you can more confidently delegate efforts and ensure effective oversight.
Improving observability
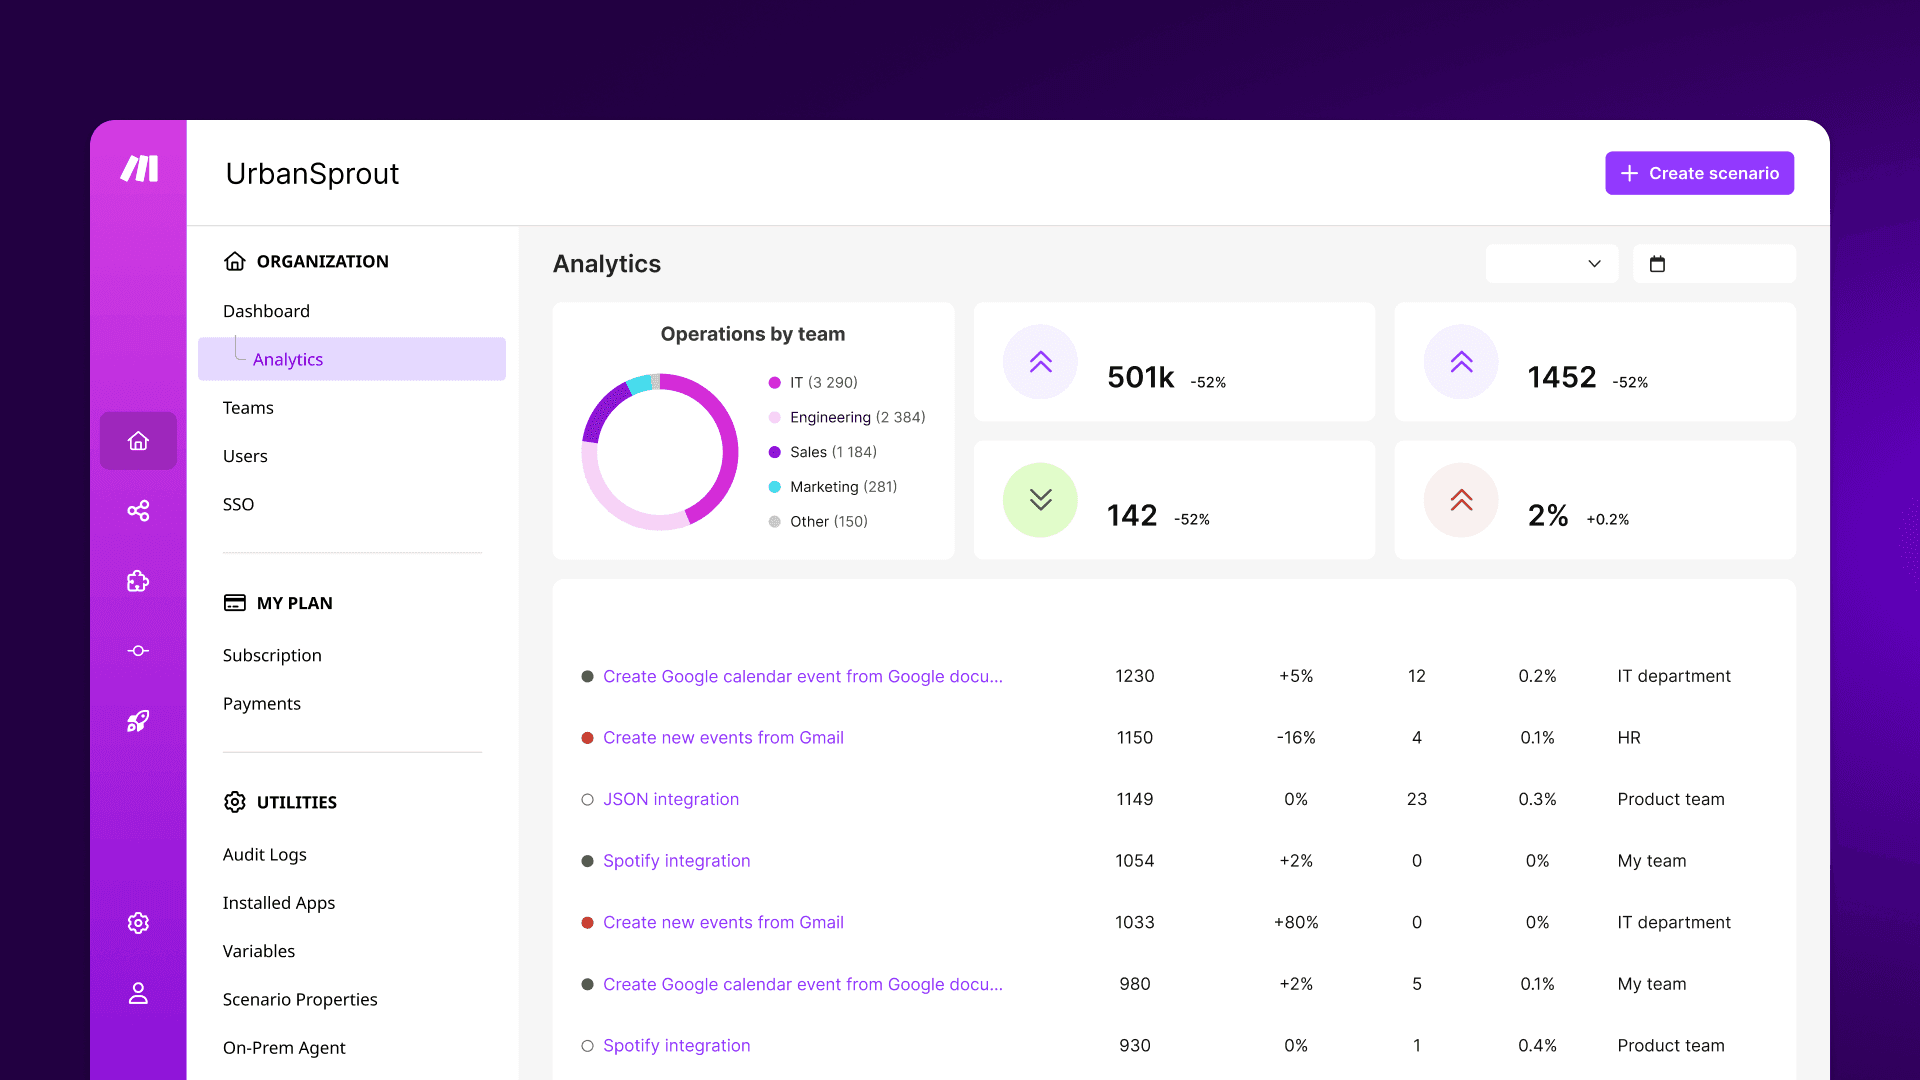
With all of this in mind, a few weeks ago at our annual customer conference Waves ‘24, we launched a new Analytics Dashboard on the Enterprise plan, that provides greater transparency over operations usage.
The dashboard includes key features such as visibility into operation usage in different teams, giving users the opportunity to compare and review consumption and identify if something out of the ordinary is happening - or to spot trends within their account.
Users also have the opportunity to review usage and error rates by scenarios to better understand where to focus to improve overall portfolio health. Currently users have visibility into the past 30 days, with an additional 30 days being used to calculate trends. We’re working on extending the history and hope to have an update on this soon.
With transparency comes control
Knowledge is power - the more visibility you have on the usage within your account the more confident you can feel about delegating efforts to more people and teams across your organization. This means you can reap the benefits of automation in more parts of your organization.
All of this work is part of a larger effort and investment designed to help users maintain momentum as they grow.
The Analytics Dashboard comes as standard as part of the Make Enterprise package. Find out more about our enterprise benefits and get started today.
Want more detail?
Watch my presentation from Waves '24, where I introduced the new Analytics Dashboard.
Find out how customers are using the Analytics Dashboard.
Ready to make the automation revolution happen?