Connect OpenAI (ChatGPT, Sora, Whisper) and Image-Charts integrations
Transform OpenAI insights into stunning visual analytics automatically. Connect ChatGPT, Sora, DALL-E, and Whisper with Image-Charts to instantly convert AI-generated data into professional charts and graphs—no manual work required. Harness the power of automated data visualization that turns your OpenAI outputs into actionable graphics in seconds.
Triggers when a batch is completed.
Triggers when a video job is created.


Creates a URL of a PNG image displaying a Bar Chart.
Creates a URL of a PNG image displaying a Bubble Chart.
Creates a URL of a PNG image displaying a Chart. Advanced usage.
Creates a URL of a PNG image displaying a Chart.js Chart. Advanced usage.
Creates a URL of a PNG image displaying a Line Chart.
Creates a URL of a PNG image displaying a Pie Chart.
Creates a URL of a PNG image displaying a QR Code Chart.
Creates a URL of a PNG image displaying a Radar Chart.
Creates a URL of a PNG image displaying a Scatter Chart.
Creates a URL of a PNG image displaying a Sparkline Chart.
Trusted by thousands of fast-scaling organizations around the globe
Automate your work. Build something new.
Just drag and drop apps to automate existing workflows or build new complex processes. Solve problems across all areas and teams.
Build your OpenAI (ChatGPT, Sora, Whisper) and Image-Charts integrations.
Image-Charts serves as a trigger that initiates automated workflows when it generates insights, analyzes content, or creates descriptions using advanced artificial intelligence capabilities. Once triggered, OpenAI (ChatGPT, Sora, Whisper) functions as the action that automatically converts OpenAI's outputs into charts and graphs, enabling data visualization. This trigger-action integration allows OpenAI-generated data to flow directly into OpenAI (ChatGPT, Sora, Whisper), which then produces visual analytics without manual intervention, transforming AI-powered insights into actionable graphics through automated workflows.
Adds files to a specified vector store or, if not specified, creates a new vector store based on the configuration.
Analyzes images according to specified instructions.
Cancels an "in-progress" batch. The batch will be in status "cancelling" for up to 10 minutes, before changing to "cancelled", where it will have partial results (if any) available in the output file.
Creates a URL of a PNG image displaying a Bar Chart.
Creates a URL of a PNG image displaying a Bubble Chart.
Creates a URL of a PNG image displaying a Chart. Advanced usage.
Creates a URL of a PNG image displaying a Chart.js Chart. Advanced usage.
Creates a URL of a PNG image displaying a Line Chart.
Creates a URL of a PNG image displaying a Pie Chart.
Popular OpenAI (ChatGPT, Sora, Whisper) and Image-Charts workflows.
Looking to get more out of OpenAI (ChatGPT, Sora, Whisper) and Image-Charts? With Make you can visually integrate OpenAI (ChatGPT, Sora, Whisper) and Image-Charts into any workflow to save time and resources — no coding required. Try any of these templates in just a few clicks.
How to setup OpenAI (ChatGPT, Sora, Whisper) and Image-Charts in 5 easy steps
Create a new scenario in Make
Log into your Make account and start a new scenario, which is an automated workflow that connects your apps. Think of a scenario as a recipe that tells your applications how to work together automatically without you having to do the work manually each time.
Add OpenAI GPT-3 as your first step
Select OpenAI GPT-3 from Make's app library and choose what action you want it to perform, like generating text or analyzing information. Then connect your OpenAI account to Make by entering your credentials so the platform can access GPT-3's features on your behalf.
Add Image-Charts as your second step
Click the plus button to add Image-Charts to your workflow and select the type of chart you want to create, such as a bar chart, line chart, or pie chart. Connect your Image-Charts account to Make by following the authentication steps so the two platforms can communicate.
Link the data between your apps
Map the information from OpenAI GPT-3 to Image-Charts by dragging and dropping data points from one app to the other. This step tells Make which data from GPT-3 should be used to create your charts, such as numbers for the chart values or text for the labels.
Test and activate your workflow
Run a test to make sure both apps are talking to each other correctly and producing the charts you expect. Once everything looks good, turn on your scenario so it runs automatically whenever triggered, creating charts from your GPT-3 data without any manual work from you.
Transform AI intelligence into visual impact with automated chart generation
Integrate OpenAI and Image-Charts to automatically convert AI-generated insights into stunning visual charts, enabling natural language data visualization and scalable report creation without manual work.
Transform OpenAI's text-based analytics and data processing results into beautiful charts automatically without manual data entry.
Use ChatGPT to interpret user requests and dynamically generate appropriate chart configurations that Image-Charts renders instantly.
Combine OpenAI's content generation capabilities with Image-Charts to create comprehensive reports that include both narrative insights and visual data representations.
Enable users to describe their data visualization needs in plain language to OpenAI, which then creates the proper Image-Charts API parameters automatically.


FAQ
With Make, you can connect OpenAI and Image-Charts to transform AI-generated insights into beautiful visualizations. For example, you can use OpenAI's GPT models to analyze data, generate statistics, or create reports, then automatically pass that structured data to Image-Charts to create professional charts with a single API call. This integration eliminates manual data transfer and chart creation, allowing you to build automated workflows that turn AI insights into visual presentations instantly.
The integration enables powerful automation scenarios such as: automatically generating sales performance charts from AI-analyzed business data, creating visual reports from ChatGPT's data summaries, building automated dashboard updates where OpenAI processes metrics and Image-Charts visualizes them, generating infographics from AI-written content, or creating educational materials where GPT generates quiz results that are instantly visualized. Make's no-code platform lets you build these workflows in minutes without programming knowledge, connecting triggers, data processing through OpenAI, and chart generation through Image-Charts in a single automated sequence.
Make's visual workflow builder makes it straightforward to connect OpenAI and Image-Charts without any coding. You drag and drop modules for each app, authenticate your accounts with a few clicks, and configure what data flows between them using Make's intuitive interface. Make provides pre-built templates and handles all the complex API interactions behind the scenes. You can start with a free Make account to test the integration, and the platform offers extensive documentation and support to guide you through each step of creating your first automated workflow.
Make eliminates the technical complexity and ongoing maintenance burden of custom integrations. Instead of writing and maintaining code to handle API authentication, error handling, data formatting, and rate limits for both OpenAI and Image-Charts, Make manages all of this automatically. You also gain access to powerful features like conditional logic, data transformation tools, error handling, scheduling, and the ability to add other apps to your workflow. Make's visual interface lets you modify your automation in minutes versus hours of coding, and you can monitor all executions in real-time. This means you can focus on your business logic rather than technical implementation, while enjoying enterprise-grade reliability and scalability.
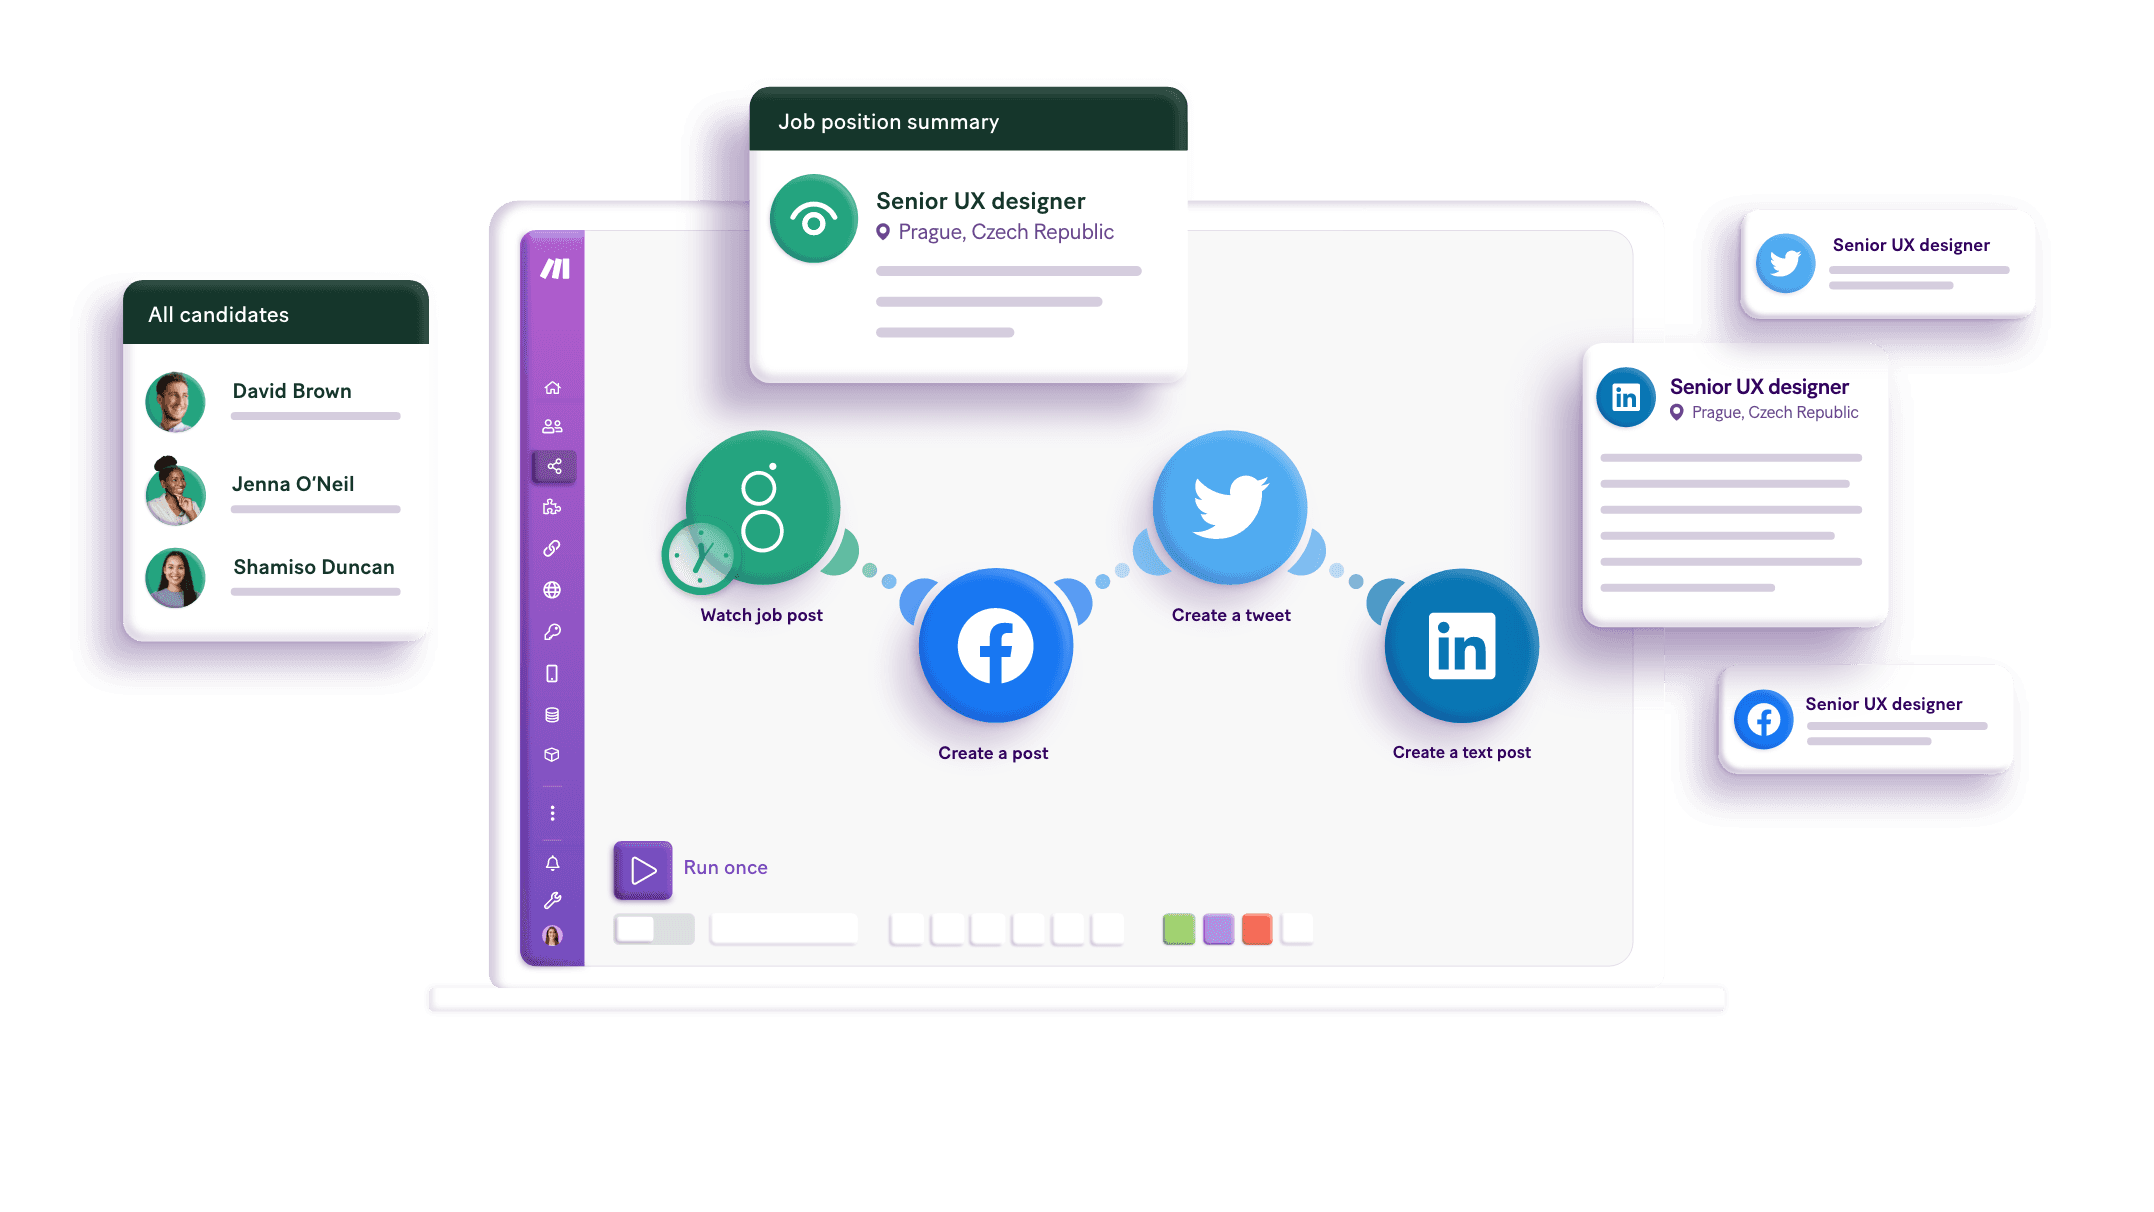
A scenario represents a workflow or a project of your own creation, and it is made up of a series of modules that automate apps and services. Creating a scenario allows you to transfer and transform data between apps and services via these modules to automate anything and improve the way you work.
Modules are the main building blocks of automation in Make. Modules represent actions that Make performs with an app, like creating, updating, or deleting data.
How it works
Traditional no-code iPaaS platforms are linear and non-intuitive. Make allows you to visually create, build, and automate without limits.
Trusted by 350,000+ customers
"Make really helped us to scale our operations, take the friction out of our processes, reduce costs, and relieved our support team. It is difficult to not become a fan."

Philipp Weidenbach
Head of Operations at Teleclinic
"Make drives unprecedented efficiency within our business in ways we never imagined. It’s having an extra employee (or 10) for a fraction of the cost."

Cayden Phipps
COO at Shop Accelerator Martech
"The simplicity, flexibility and ability to build real complex automations without any knowledge of programming makes it the best thing since sliced bread."

Erkki Markus
Product Owner at Smaily
"True citizen development in the entire company. Make is present in every department, empowering the company to offer a unique customer experience."

Andreas Stryz
CTO & Co-founder at FINN
"I can't count the number of hours I've saved by using Make. Every single day is simpler because of Make's automation."

Kimberly D
Owner of Media Production