Jun 24, 2025 | 6 minutes
How to use Make Grid
Visualize, optimize, and scale your automation with Make Grid – a real-time map of your entire automation landscape. Instantly see how scenarios, apps, and AI components connect, so you can adapt and grow with confidence.

A new level of visibility
Automation is no longer a side project; it's a strategic initiative. For growing businesses, it's a system - made up of hundreds of moving parts, connected across apps, teams, and use cases. However, as these systems scale, they often become more complex to understand, more challenging to maintain, and riskier to modify.
That’s where Make Grid comes in.
What is Make Grid?
Make and Make Grid enable businesses to visually orchestrate their entire automation and AI landscape. Grid provides a real-time, auto-generated map that displays how scenarios, apps, data stores, and AI-powered components connect, giving you the clarity to debug faster, scale smarter, and optimize with confidence. Unlike static documentation, it updates instantly as changes happen, helping you understand and evolve your ecosystem at a glance.
It’s designed for teams with serious scale - multiple users, dozens of scenarios, and fast-moving priorities. If that’s you, Grid becomes your command center for collaboration, governance, and growth.
Accessing the Grid
Opening Make Grid is simple:
From the Make platform, go to the left-hand sidebar. You can also access it directly from any scenario or the scenario list.
Click on “Grid” under the Organization section.
Grid will launch in a new view, showing your entire automation landscape grouped by folders and teams.

There’s nothing to configure - Grid is automatically generated from your existing scenarios and objects. And it’s always current, so what you see reflects what’s happening across your organization.
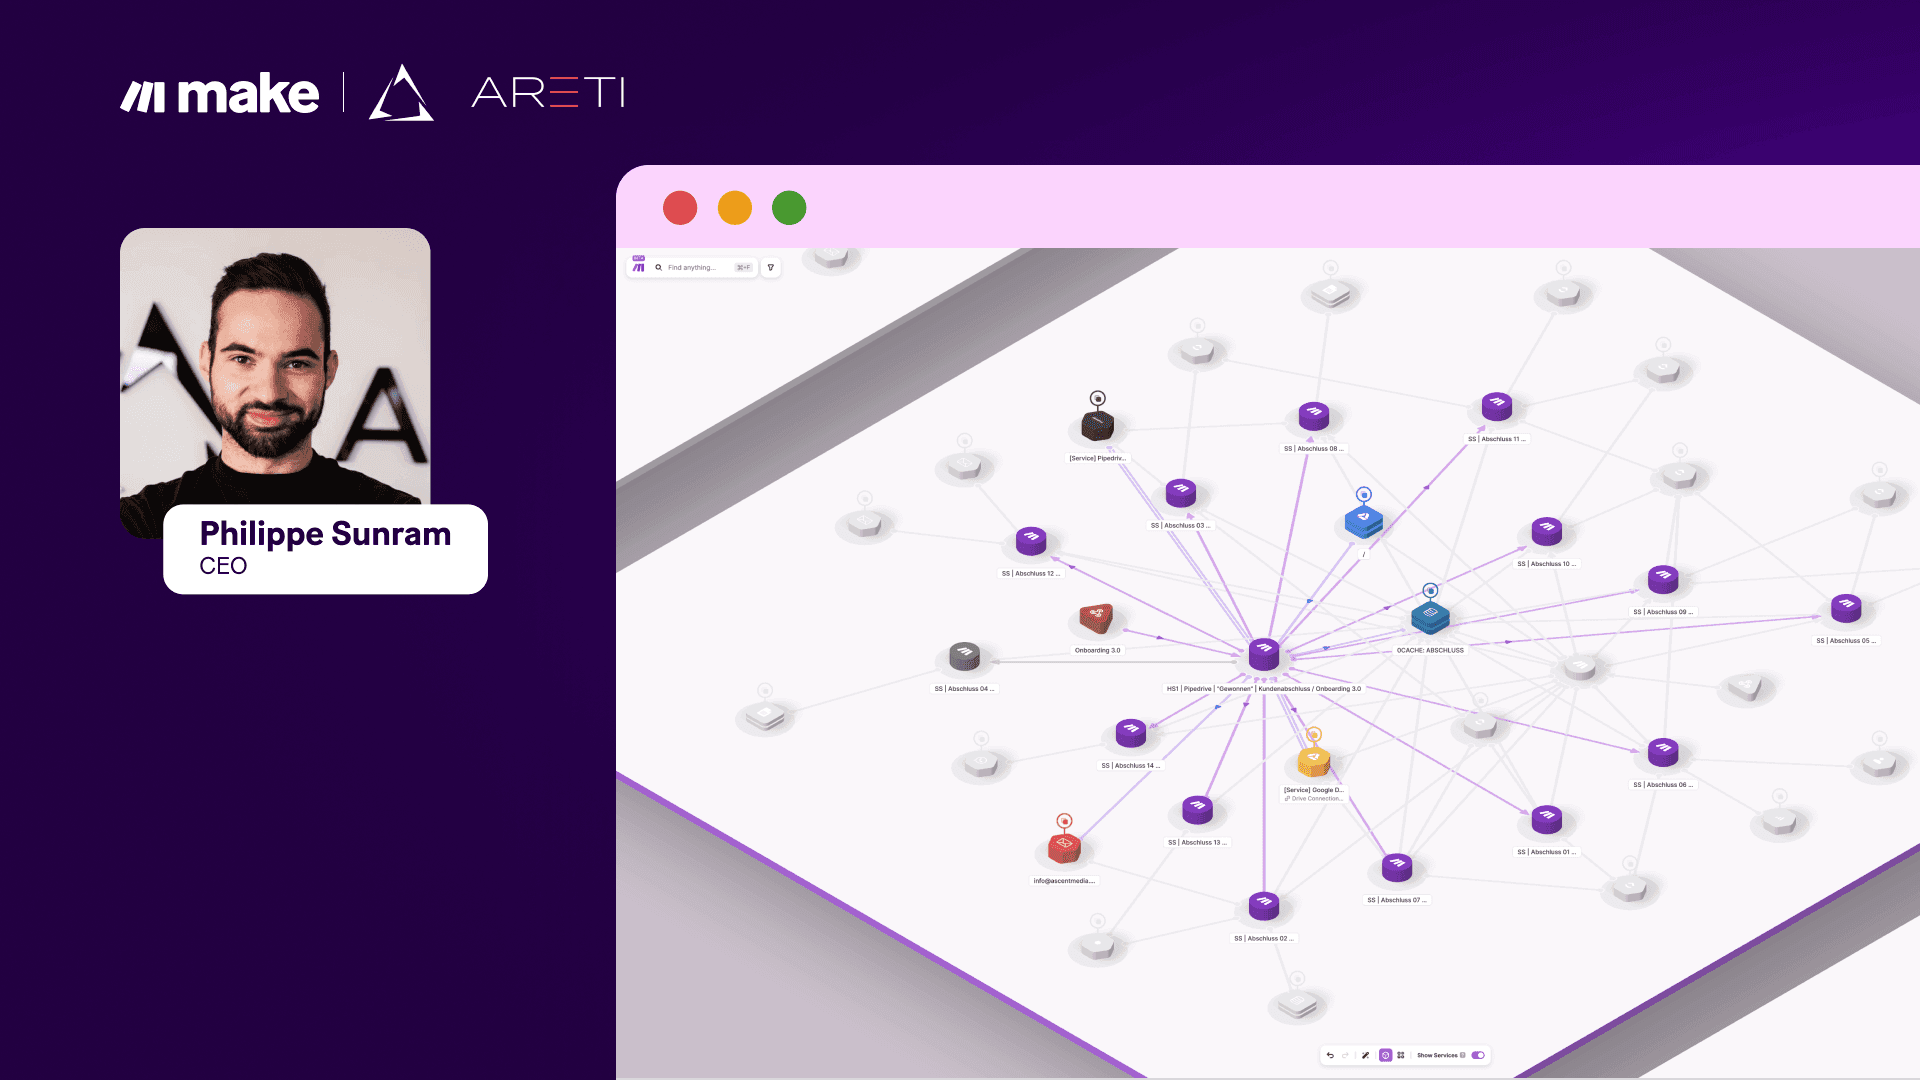
How to read the Grid: Visual legend
When Grid opens, you’ll see a 3D-style landscape made up of white tiles. Each tile represents a folder. Inside each tile are icons showing the objects that make up that system, connected by lines that describe how data flows between them.

Here’s how to interpret what you see:

Purple circles = Scenarios
Triangles = Webhooks (triggers)
Special shapes = Data storage objects
Sheets, tables, data stores, etc., all have their shape
Hexagons = Everything else
Agents, apps, HTTP modules, custom services, etc.
Lines and arrows = Connections and data flows between objects
Use the filter bar at the top to narrow your view by:

Teams
Folders
Scenario properties (status, apps being used, creator, etc.)
Custom scenario properties (if you have any)
You can also search for anything, such as a table column, URL, or app, and Grid will instantly surface the related scenarios and dependencies.
It makes Grid not just visual, but powerfully searchable - a real control center for complex automation.
Grid in action: Maintain, optimize, and scale with clarity
Make Grid isn’t just for visualizing your automation landscape - it’s a powerful tool for maintaining system health, optimizing performance, and scaling with confidence. Every feature is designed to help you take clear, focused action. Here’s how:
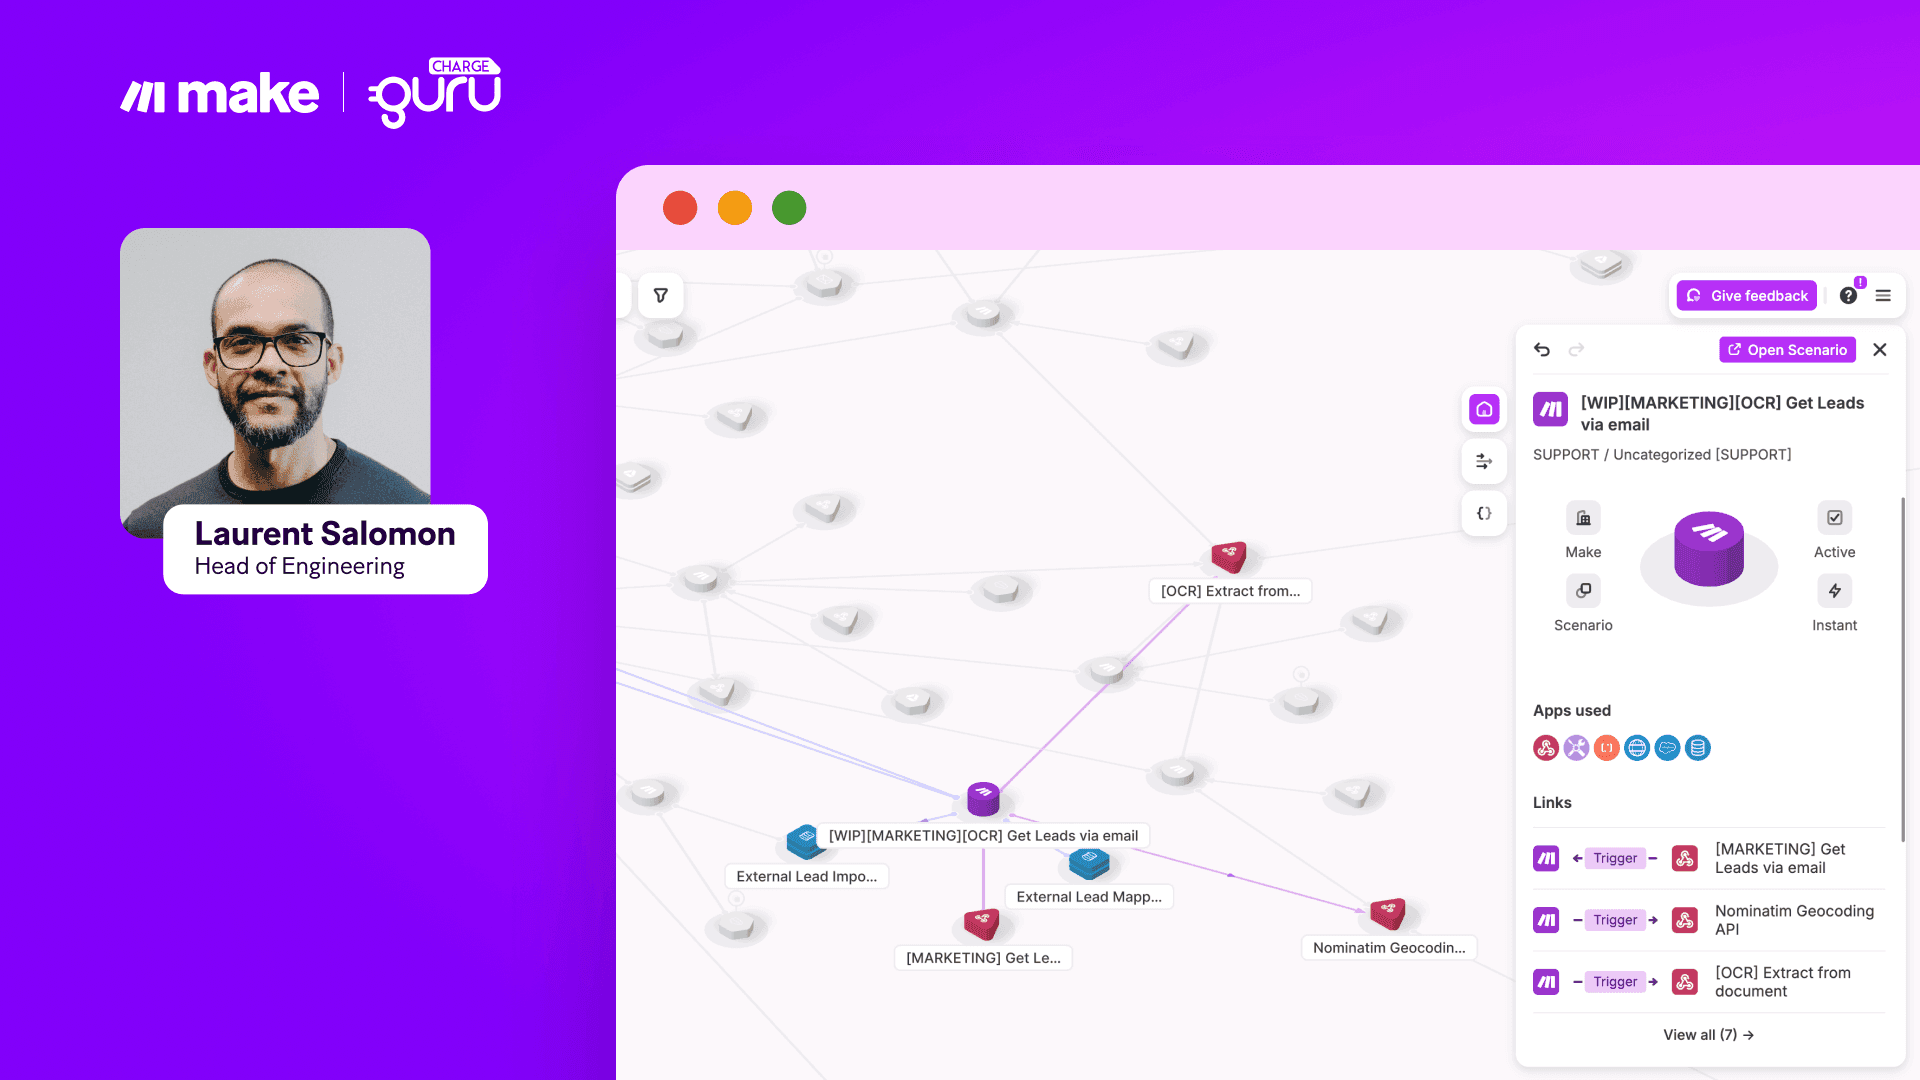
Gain a holistic view
Grid gives you a real-time, visual map of your entire automation ecosystem. Zoom out to understand how folders, teams, and solutions connect - or zoom in to explore specific flows, modules, or objects in detail.

Identify dependencies with zero guesswork
Need to swap out a shared table or API? Grid instantly shows which scenarios rely on it - so you can avoid surprises and safely update core components. → Example: Replace a Google Sheet or Airtable table by first identifying all connected scenarios - no manual checks required.

Focus on what matters
Use filters to surface active or high-priority flows. Quickly locate production scenarios, AI usage, or stalled executions - and act with purpose. → Example: Filter to only show production scenarios that include Make AI Agents and were deactivated because of errors. Fix issues fast without digging through lists.

Audit data usage and streamline cleanups
Trying to deprecate a column or object? Just search by name. Grid shows you where it’s referenced, down to the field level. → Example: Search “Jira Ticket Link” to see which scenario references that field before removing it from Airtable.

Visualize cross-functional connections
Grid highlights shared objects across folders and teams - so you can clearly see how systems overlap and avoid unintended impacts. → Example: See that a data store is used in multiple folders. Understand the ripple effect before making changes.

Spot and resolve issues instantly
Scenarios deactivated because of errors or scenarios with unresolved incomplete executions 0 helping you diagnose and resolve issues before they spread.

Optimize operations usage
Grid will also visualize which flows consume the most operations - helping you balance load and reduce waste. With these capabilities, Grid turns insight into action. It replaces static documentation with a live, interactive command center - one that evolves with you. With additions like a data transfer layer and analytics dashboard, you’ll gain even deeper insight into system performance and usage trends and immediately spot the folders and scenarios contributing the most to your bill.

Support compliance, security, and scale
As automation becomes core infrastructure, visibility isn’t just helpful - it’s essential. Make Grid supports security, compliance, and IT governance by making it easy to trace sensitive data, monitor AI usage, and understand system-wide behavior.
Scale with confidence Whether you're restructuring folders, onboarding new teams, or expanding your automation footprint, Grid provides everyone with a shared, up-to-date view. That means faster decision-making and smoother scaling - without fear of losing control.
Follow sensitive data flows Need to know where Salesforce contacts, email addresses, or other personal data are going? Grid lets you trace connections from source to destination - across scenarios, apps, and services.
Map your AI usage Whether for transparency or policy compliance, Grid helps you identify every scenario using AI – from OpenAI modules to Make AI Agents – so you can assess risk, standardize practices, or report usage organization-wide.
Enable IT and privacy teams With Grid, senior IT leads and privacy officers gain instant observability. No more chasing down answers across teams or documentation. They can see what’s happening, where it’s happening, and what it touches - all without asking for a walkthrough.
Grid helps keep your systems trustworthy, auditable, and adaptable - even as they grow.
Conclusion: Scale smarter with Make Grid
Make Grid turns complexity into clarity. It provides a living, interactive view of your automation landscape, allowing you to troubleshoot faster, collaborate more effectively, and scale without hesitation.
Whether you're replacing a shared object, onboarding a new team member, or auditing data flows across your organization, Grid gives you the visibility you need to act with confidence.
The more you see, the more powerful you feel.
Open Make Grid today and explore your automation like never before.