Nov 14, 2024 | 3 minutes
Introducing Make Grid: See, scale, and build with confidence

UPDATE: The open beta launch of Make Grid was announced on June 24th 2025
Ever wished you could see exactly how all your automated workflows, systems and data are connected?
We’re thrilled to introduce Make Grid, a groundbreaking new tool — currently in beta — that brings this functionality to life.
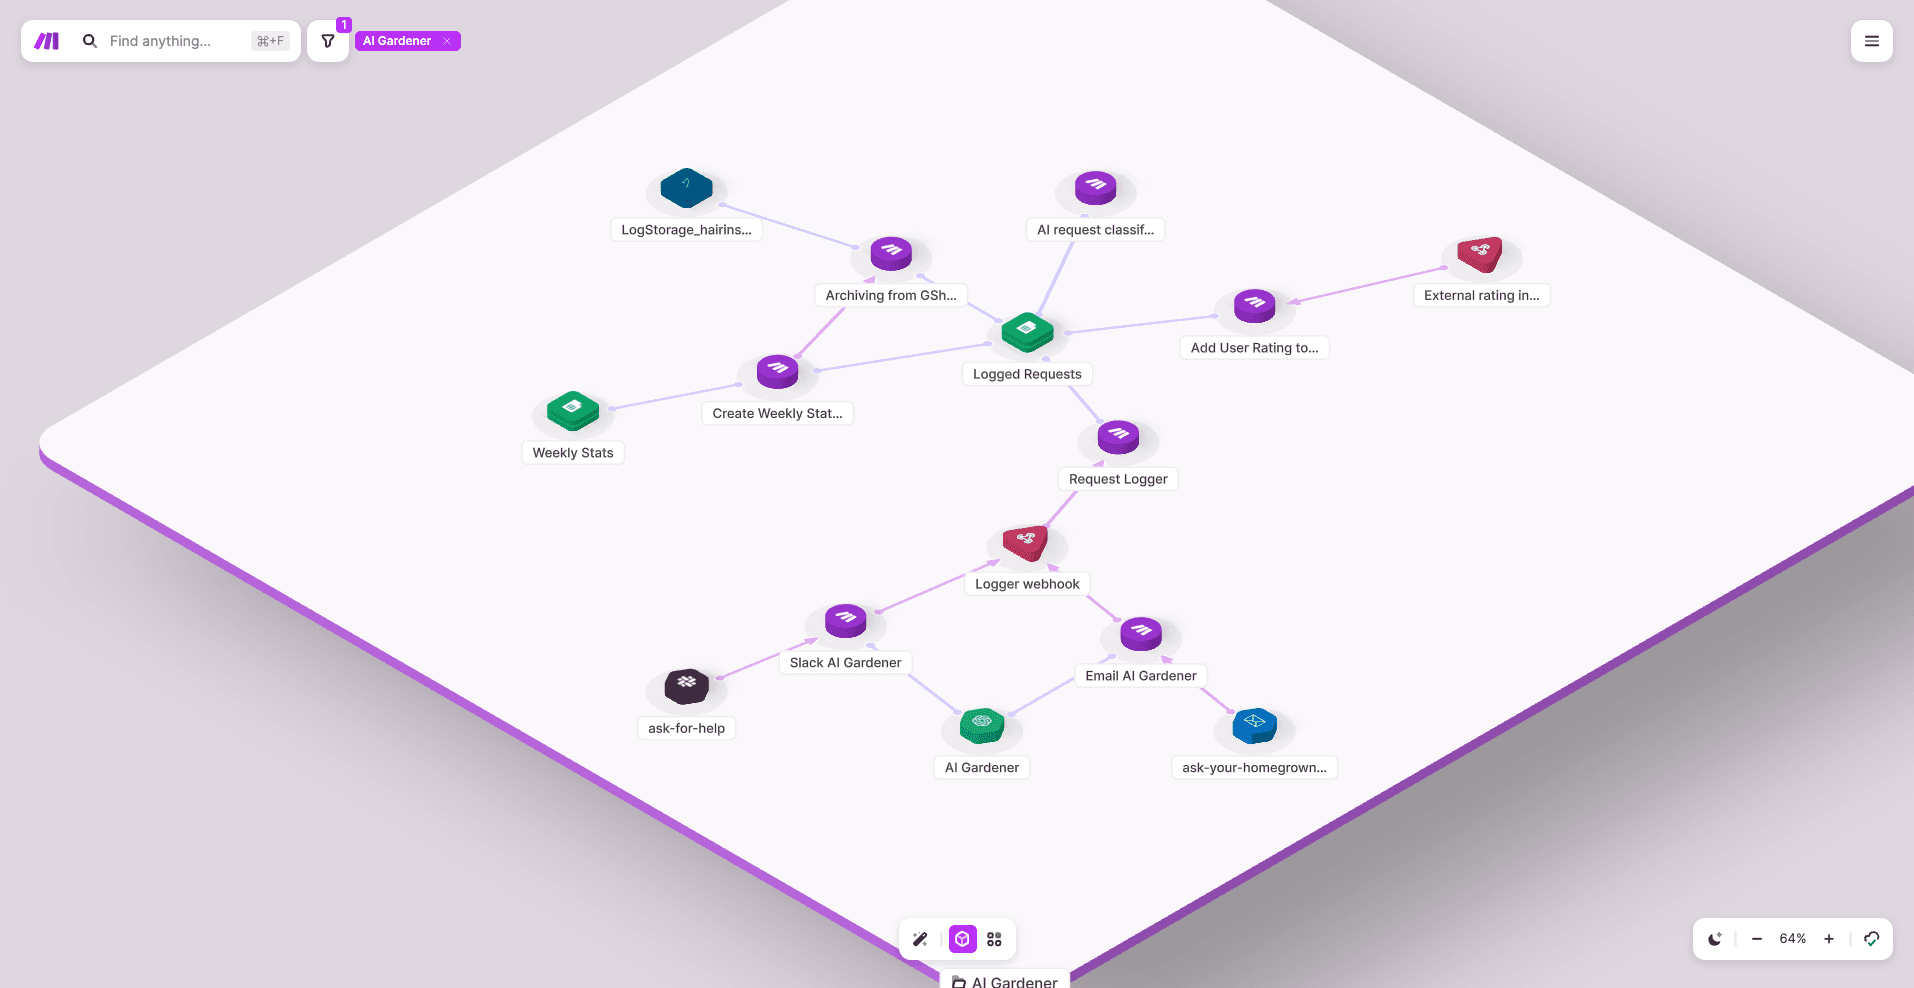
Make Grid visually displays your entire automation landscape in one place and is designed to help you manage the complexity of automation at scale, with a unique visual experience.
As a centralized source of truth, it reveals how objects are connected and how information is flowing through your organization, so you and your team can move faster and make changes with confidence.
In this blog, we’ll share the story behind Make Grid, plus how it can help you gain control of your automation landscape — and how you can get involved in the beta program.
The story behind Make Grid
When we launched Make in 2016, our mission was clear: To democratize automation through an accessible, no-code platform. Since then, we’ve watched you build powerful, creative automations that go beyond anything we imagined.
But with great automation inevitably comes great complexity. As many of our users know, managing large-scale automations — spread across multiple tools like Airtable, Google Sheets, and OpenAI — brings a unique set of challenges.
Here are some of the challenges we’ve picked up on when managing complex automations:
Tracking dependencies. Finding every instance of an object — like a Google Sheet or webhook — across workflows is tricky, especially when replacing tools or locating triggers.
Worrying about ‘breaking’ things. Making changes, like updating Airtable fields or webhook responses, can feel risky because you can’t easily see downstream impacts.
Understanding others’ automations. When a colleague moves on or is out on PTO, it can be hard to understand the workflows they have built without a lot of effort and expertise.
To help manage these complexities, many Make users invest a lot of time in creating complex diagrams and dependency tables for their documentation (which quickly become outdated), with some even building custom tooling.
All this takes time and energy that could instead be spent on growing the business. Make Grid is here to solve that.
How Make Grid can help
Currently available in a closed beta, Make Grid is an interactive, automatically generated map of your automation solutions that show you exactly how all your applications connect and how data flows across them.
With a few simple filters, you can zoom in on the details that matter to you, or zoom out for a big-picture view.
Our visual-first approach makes it easy to understand the connections and dependencies that can otherwise get tangled up in complex systems.
With Make Grid, you can:
Build with confidence. See dependencies at a glance, so you can make changes without worrying about breaking things.
Boost collaboration. With everyone on the same page, handovers and teamwork become smoother.
Gain a holistic view. Spot optimization opportunities and keep your automations running efficiently.
Avoid issues. Quickly identify and fix points of failure and assess their impact.
Enhance visibility. Gain peace of mind with greater transparency across your workflows.
Increase agility. Empower your teams to innovate and automate faster, even as your business faces change from customer demands and evolving technology.
Learn more about Make Grid during our launch at Waves ‘24.
Get involved
Want to try Make Grid? Sign up to join the beta waitlist to be among the first ones to access Make Grid.
While we can’t guarantee that everyone who signs up will be selected, we appreciate your enthusiasm and willingness to partner in the continued evolution of Make.


