Jun 27, 2025 | 5 minutes
Why Make builds visual-first software
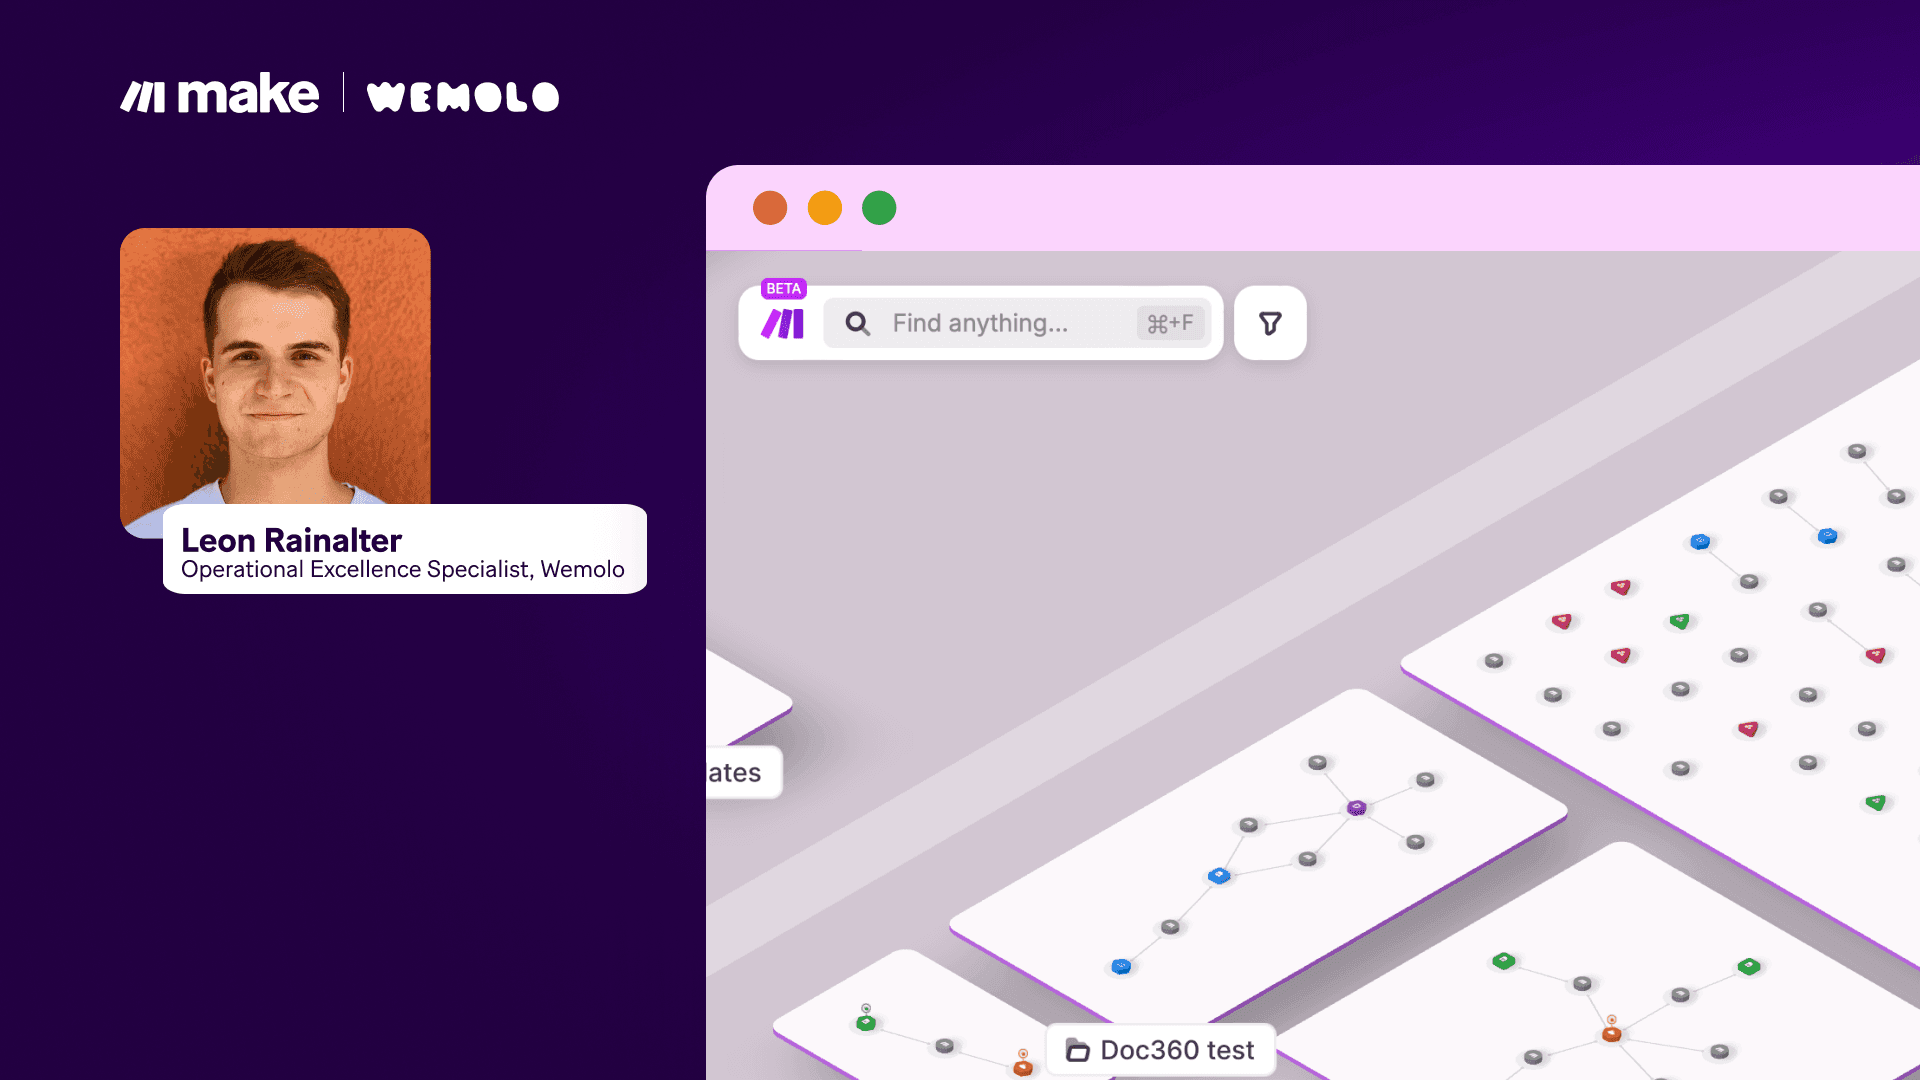
Patrik Simek, CTO and co-founder of Make, lays out why seeing more is fundamental to knowing more and doing more as you automate, orchestrate, and collaborate.
The Grid. A digital frontier. I tried to picture clusters of information as they moved through the computer. What did they look like? Ships? Motorcycles? Were the circuits like freeways? I kept dreaming of a world I thought I'd never see. And then, one day, I got in." – Kevin Flynn, Tron: Legacy (2010)
I'm a gamer at heart. That's why Tron was more than just a movie to me: it was a tangible inspiration for how we can navigate the digital landscape that's now irrevocably part of our lives. As our everyday digital experiences more and more become products of the symbiosis between humans and AI agents, indistinguishable color schemes, ultra-minimalist flat design, and explanations of operations that look straight out of Command Prompt don't cut it anymore. The idea that formulaic, stripped-down design choices keep our relationship with technology simple and tidy simply isn't fit for an increasingly nuanced and multifaceted digital frontier. Instead, we all need more understandable and more immersive ways to make sense – and make the most – of the Agentic Age.
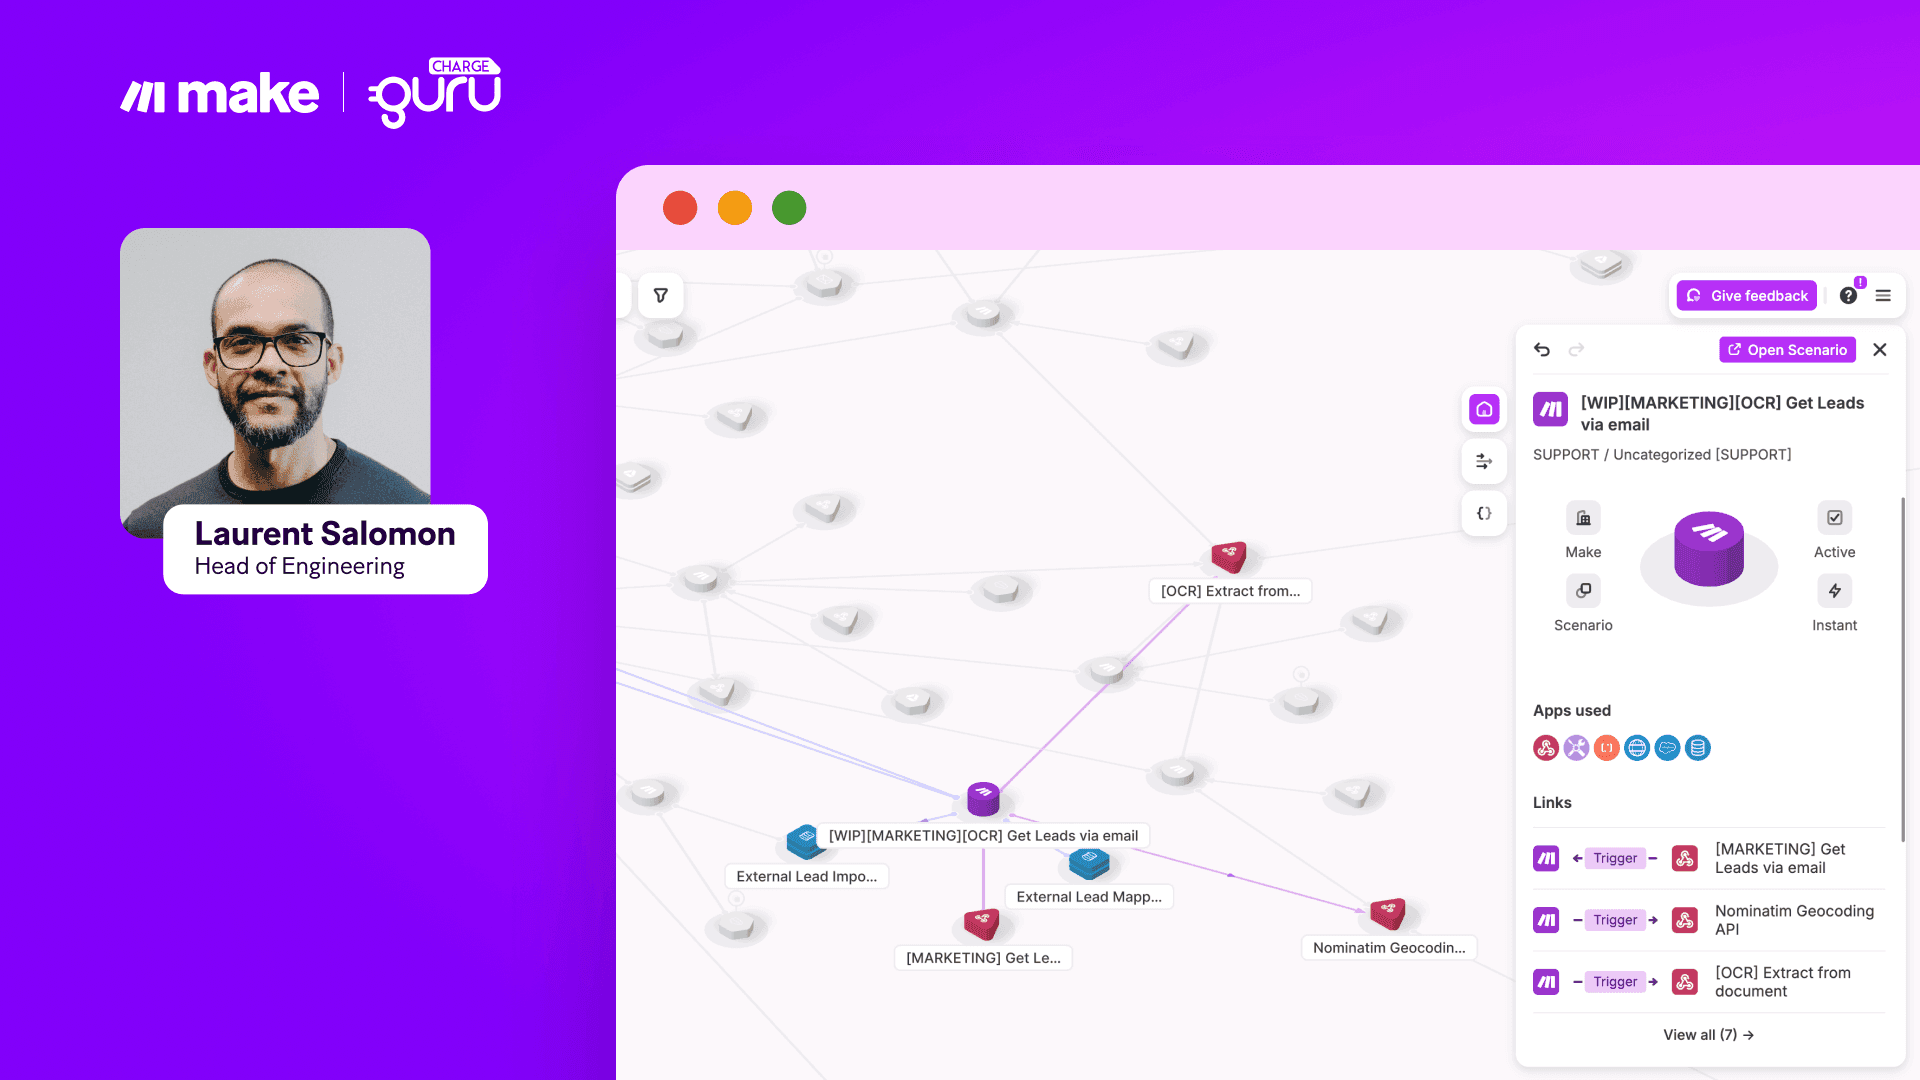
That's why we explicitly decided to chart a visual course when I co-founded Make in 2016. Building an automation and orchestration platform around visual representations helped us turn out a product that's more distinctive, more pleasant to use, and more powerful in the hands of more users. We've kicked this up one more notch with our public release of Make Grid: visualizing how your data flows and interacts across workflows and AI agents literally in multiple dimensions is the best way to help users accomplish their tasks and collaborate with human and digital colleagues better. Here's why our visual approach to automation software is so effective and why more tech builders should emphasize the visual experience when building products for our complex world.
Visuals accelerate understanding
If your offices are anything like ours, no one is ever more than two meters from a white board. Notes, charts, graphs, diagrams, and more are sketched out every day, day after day. This is because we're dealing with complex information – from how code is organized to how an interface should look to color-coded usage trends. Verbal meetings or written reports simply aren't sufficient to explain every or perhaps even most concepts. Seeing things makes grasping ideas easier and faster. And it's not just me saying so. Research out of the Massachusetts Institute of Technology (MIT) has found that humans can identify images in as little as 13 milliseconds. In this time, our eyes capture and – crucially – our brains process a huge stream of data including shape, color, orientation, and relationship, even when an image is new. The job of the eyes, says one researcher, is not just to take in information, but to funnel that information into a much more comprehensive understanding process.
The whole article is worth a read, but here's the takeaway that really stuck with me:
The fact that you can [identify images] at these high speeds indicates to us that what vision does is find concepts. That's what the brain is doing all day long – trying to understand what we're looking at. – Mary Potter, Professor of Brain and Cognitive Sciences, MIT
This is why fighter pilots use heads-up displays, why marketing departments pivot to video, why video games pursue cutting-edge graphics – and why Make scenarios use colorful modules to unmistakably show the connections between apps and animations to illustrate how data moves through your workflows. Seeing transmits ideas more quickly and in ways that are fundamentally richer than other modes of communication.
Visuals let you work better
But the power of visuals doesn't just help you understand what's in front of you. The world isn't static: visuals must – and do – help you react and adapt to changing conditions.
The same MIT study made the case that, as part of the multi-stage process of understanding, you're not just figuring out what you're seeing now, you're thinking about it rapidly enough to know what you should look at next. Another team of scientists from New York University (NYU) built on this concept as they investigated how the often-mysterious eye–brain neural network influences working memory.
What you process visually doesn't just help you in understanding the present moment or the next few moments, but also in more persistent forms of memory and planning. One researcher explains that visual memories "are the result of the neural codes dynamically evolving to incorporate how you intend to use that information in the future."
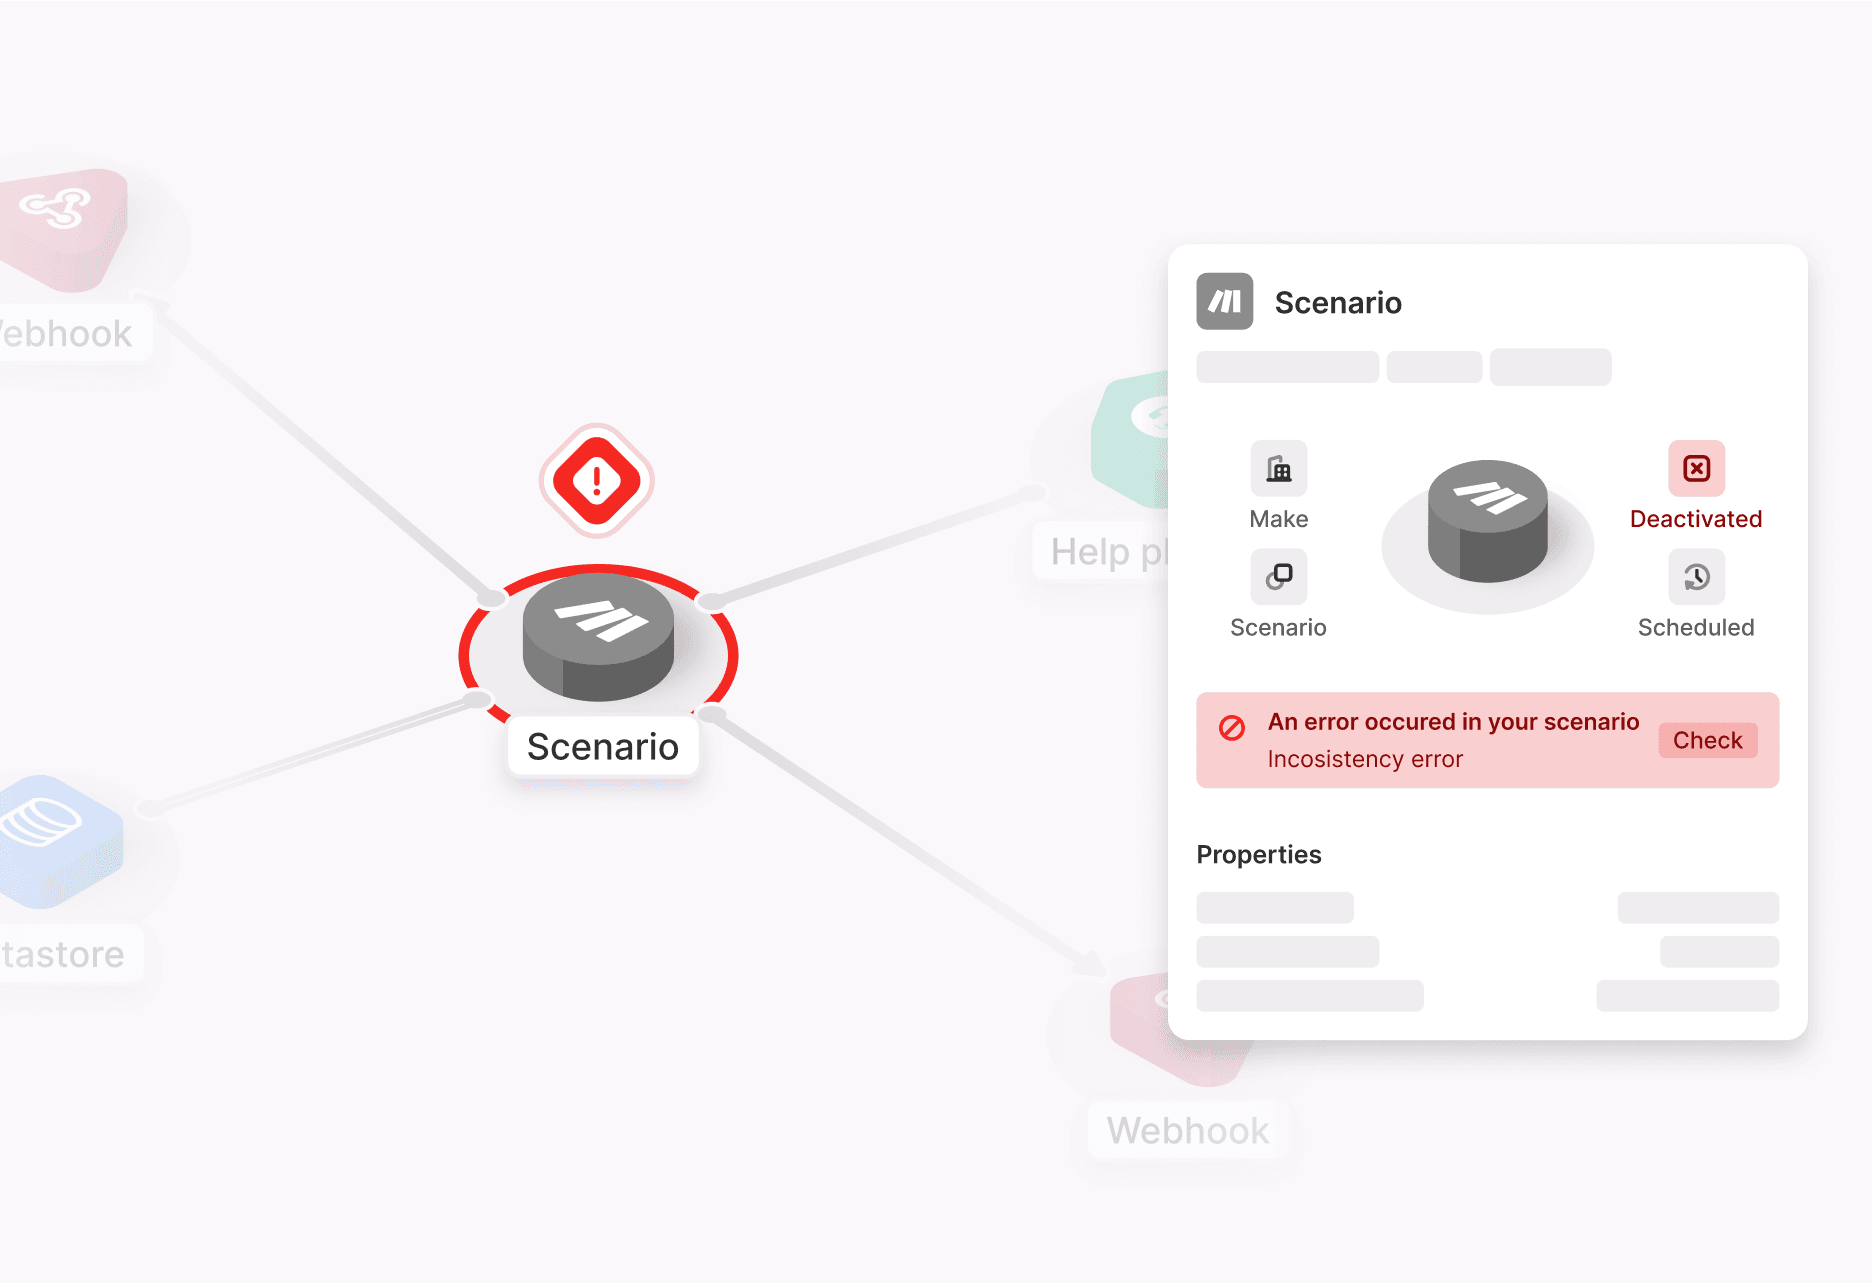
Visuals, then, give you a leg up in crystalizing what you've understood, grasping how all the concepts in your mental toolbox work together, and planning for the future, even as new information comes in and conditions change. And as anyone who has worked in a fast-moving field like ours can tell you, the colleagues most able to handle change are some of the best to have on your team. The countless success stories detailing how Make supercharges agile businesses – to save time, to head off issues, and handle edge cases in a flash – prove just this.
Visuals facilitate collaboration
But the most effective companies truly master teamwork by expertly handling the potential gaps where knowledge is transferred and responsibilities are handed over (or not, as is often the case). When ensuring things are clear to all involved, a visual approach isn't just nice to have but crucial.
I mentioned white boards above, and if your team is remote, I'd lay money on the fact that you used Miro, Jamboard, Figma, or even simple screen sharing during the last workday. Or think about the last conference you went to – did any speaker take the stage without an accompanying slide deck? The reason these visual aids are so common is because they work. Visuals make things click.
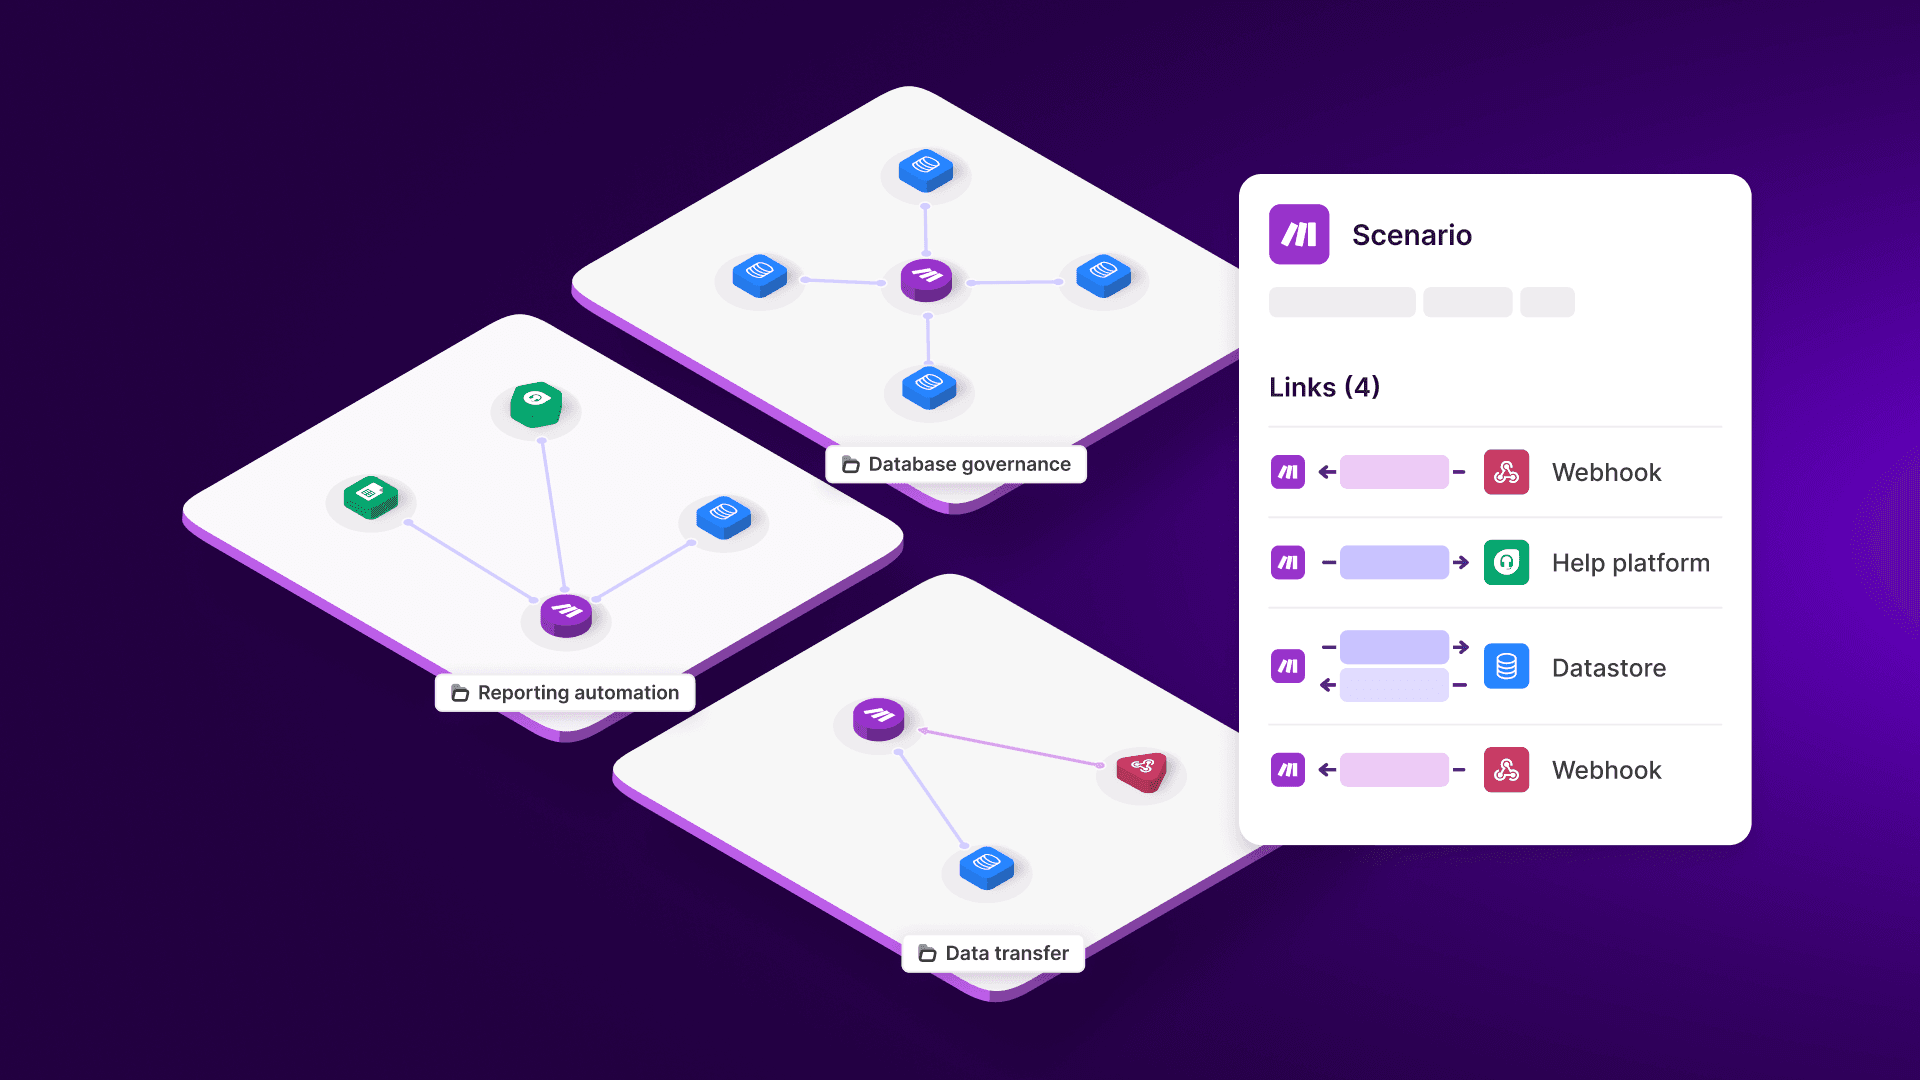
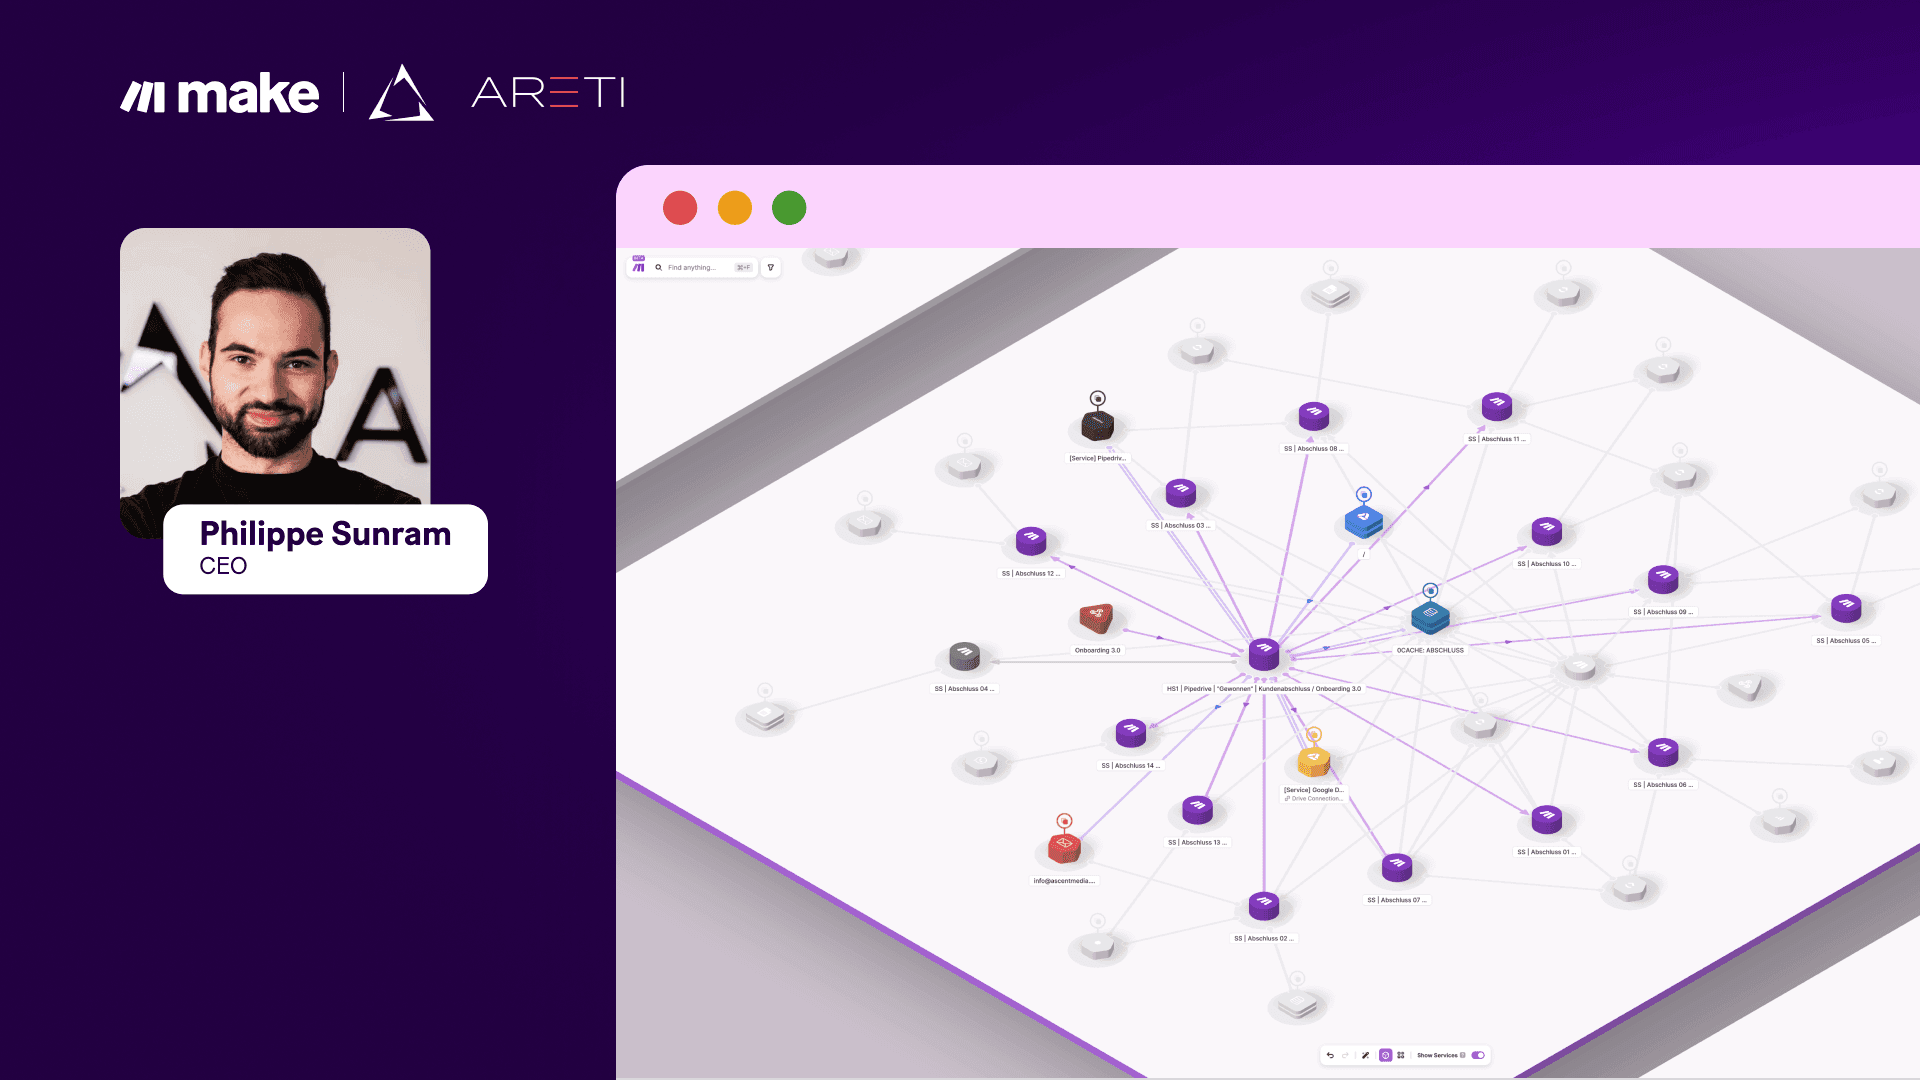
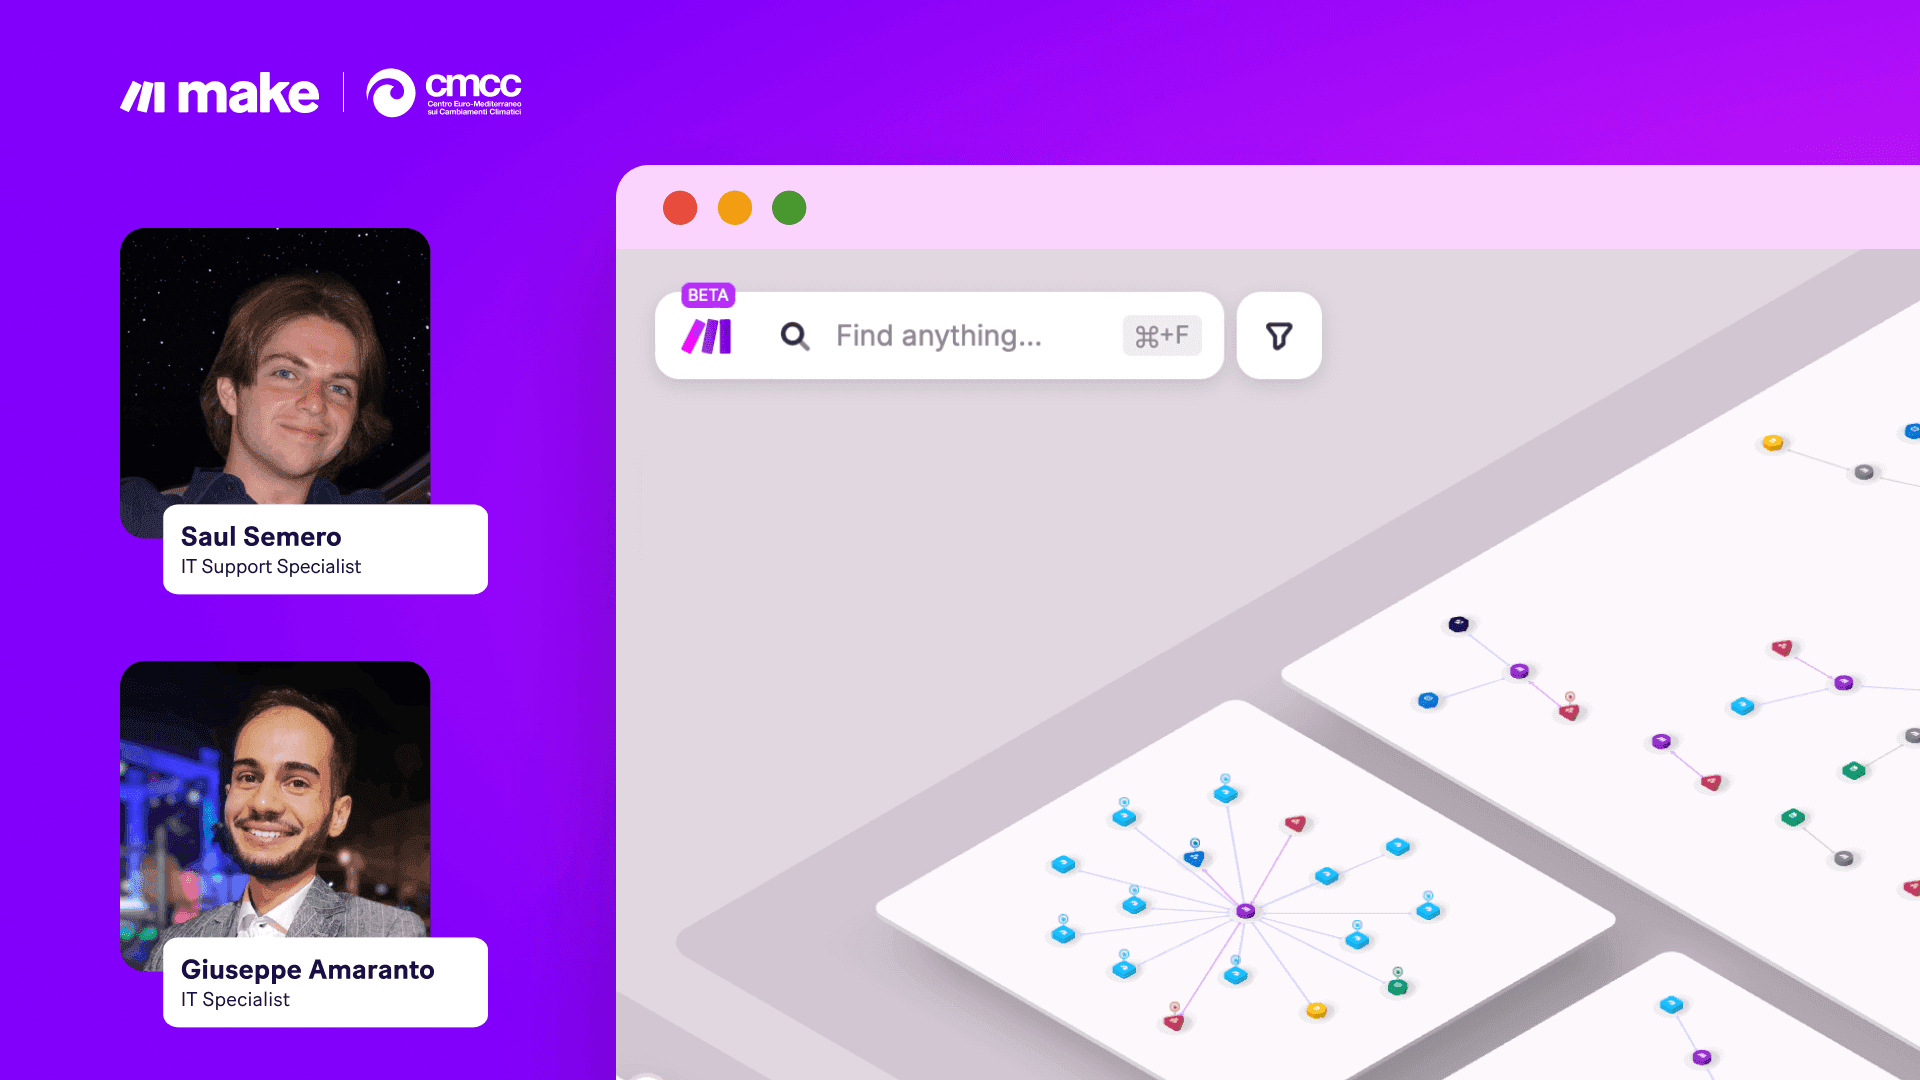
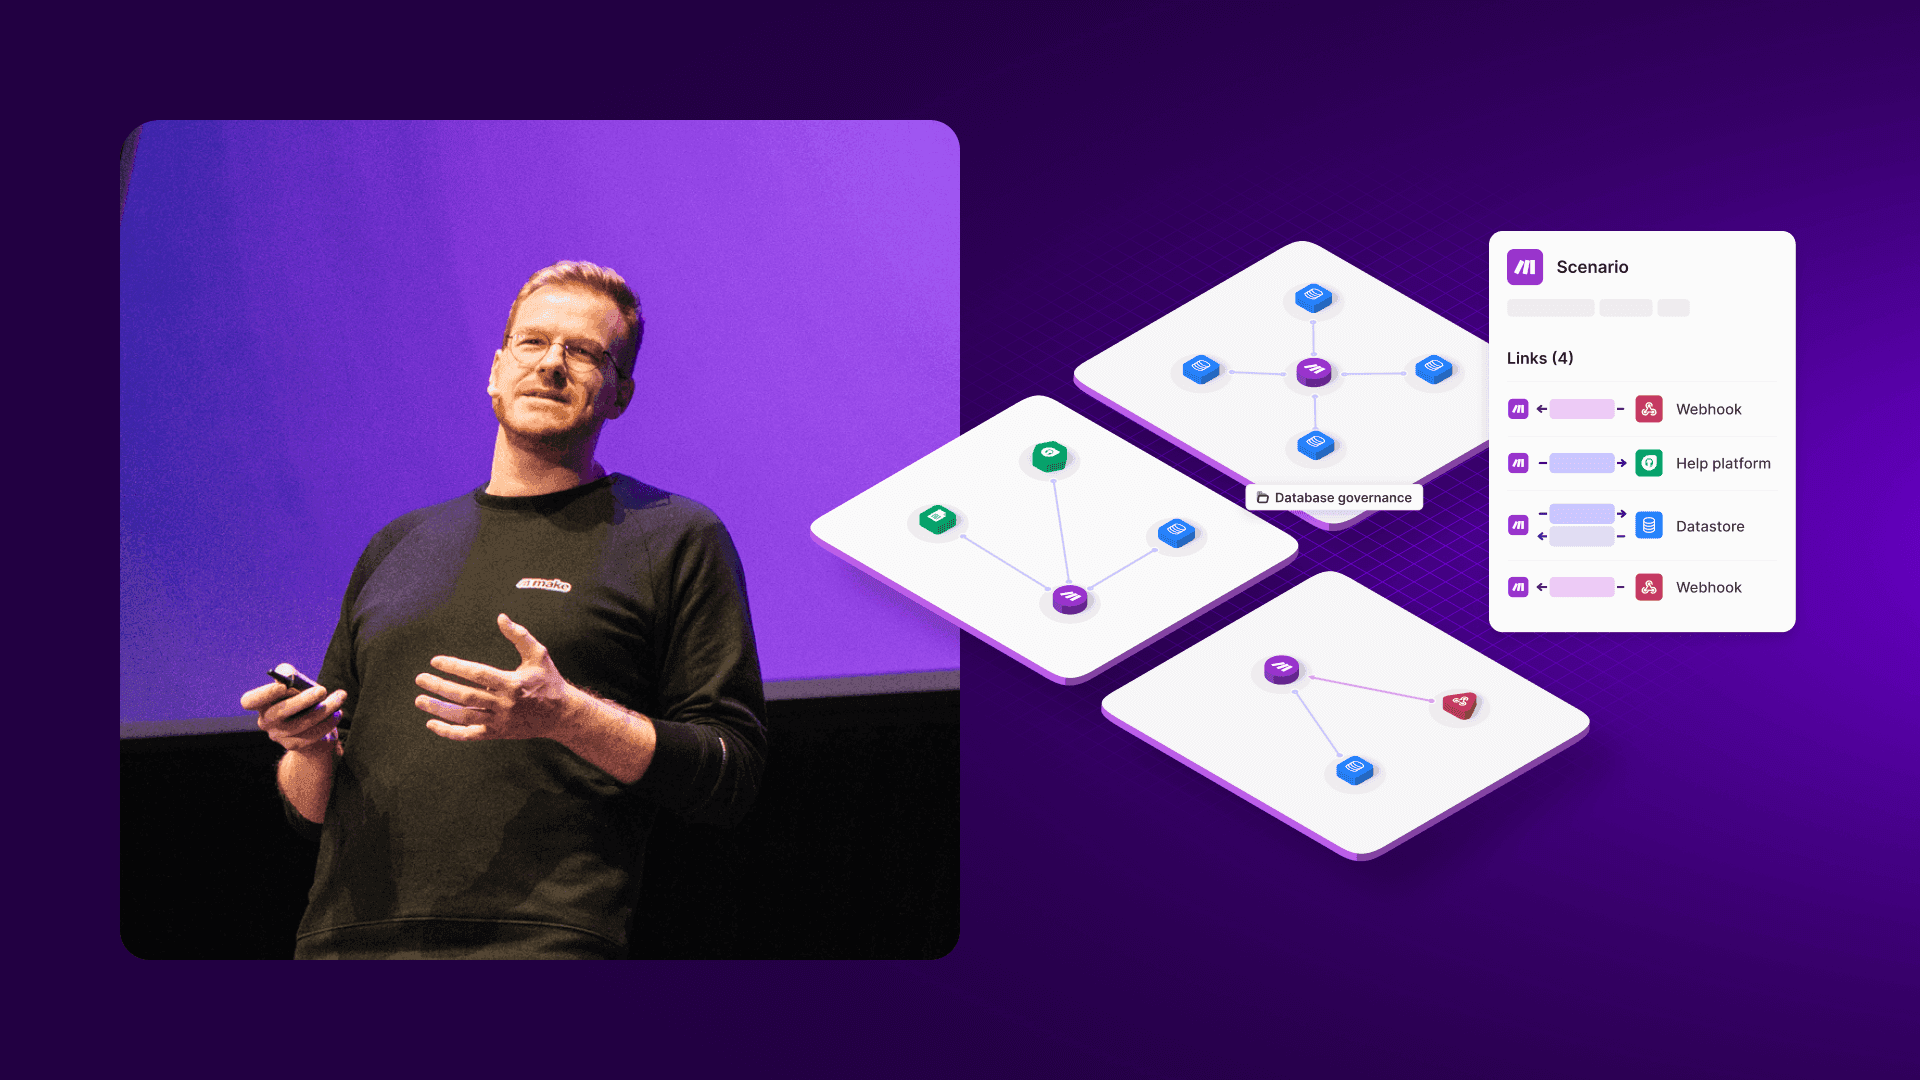
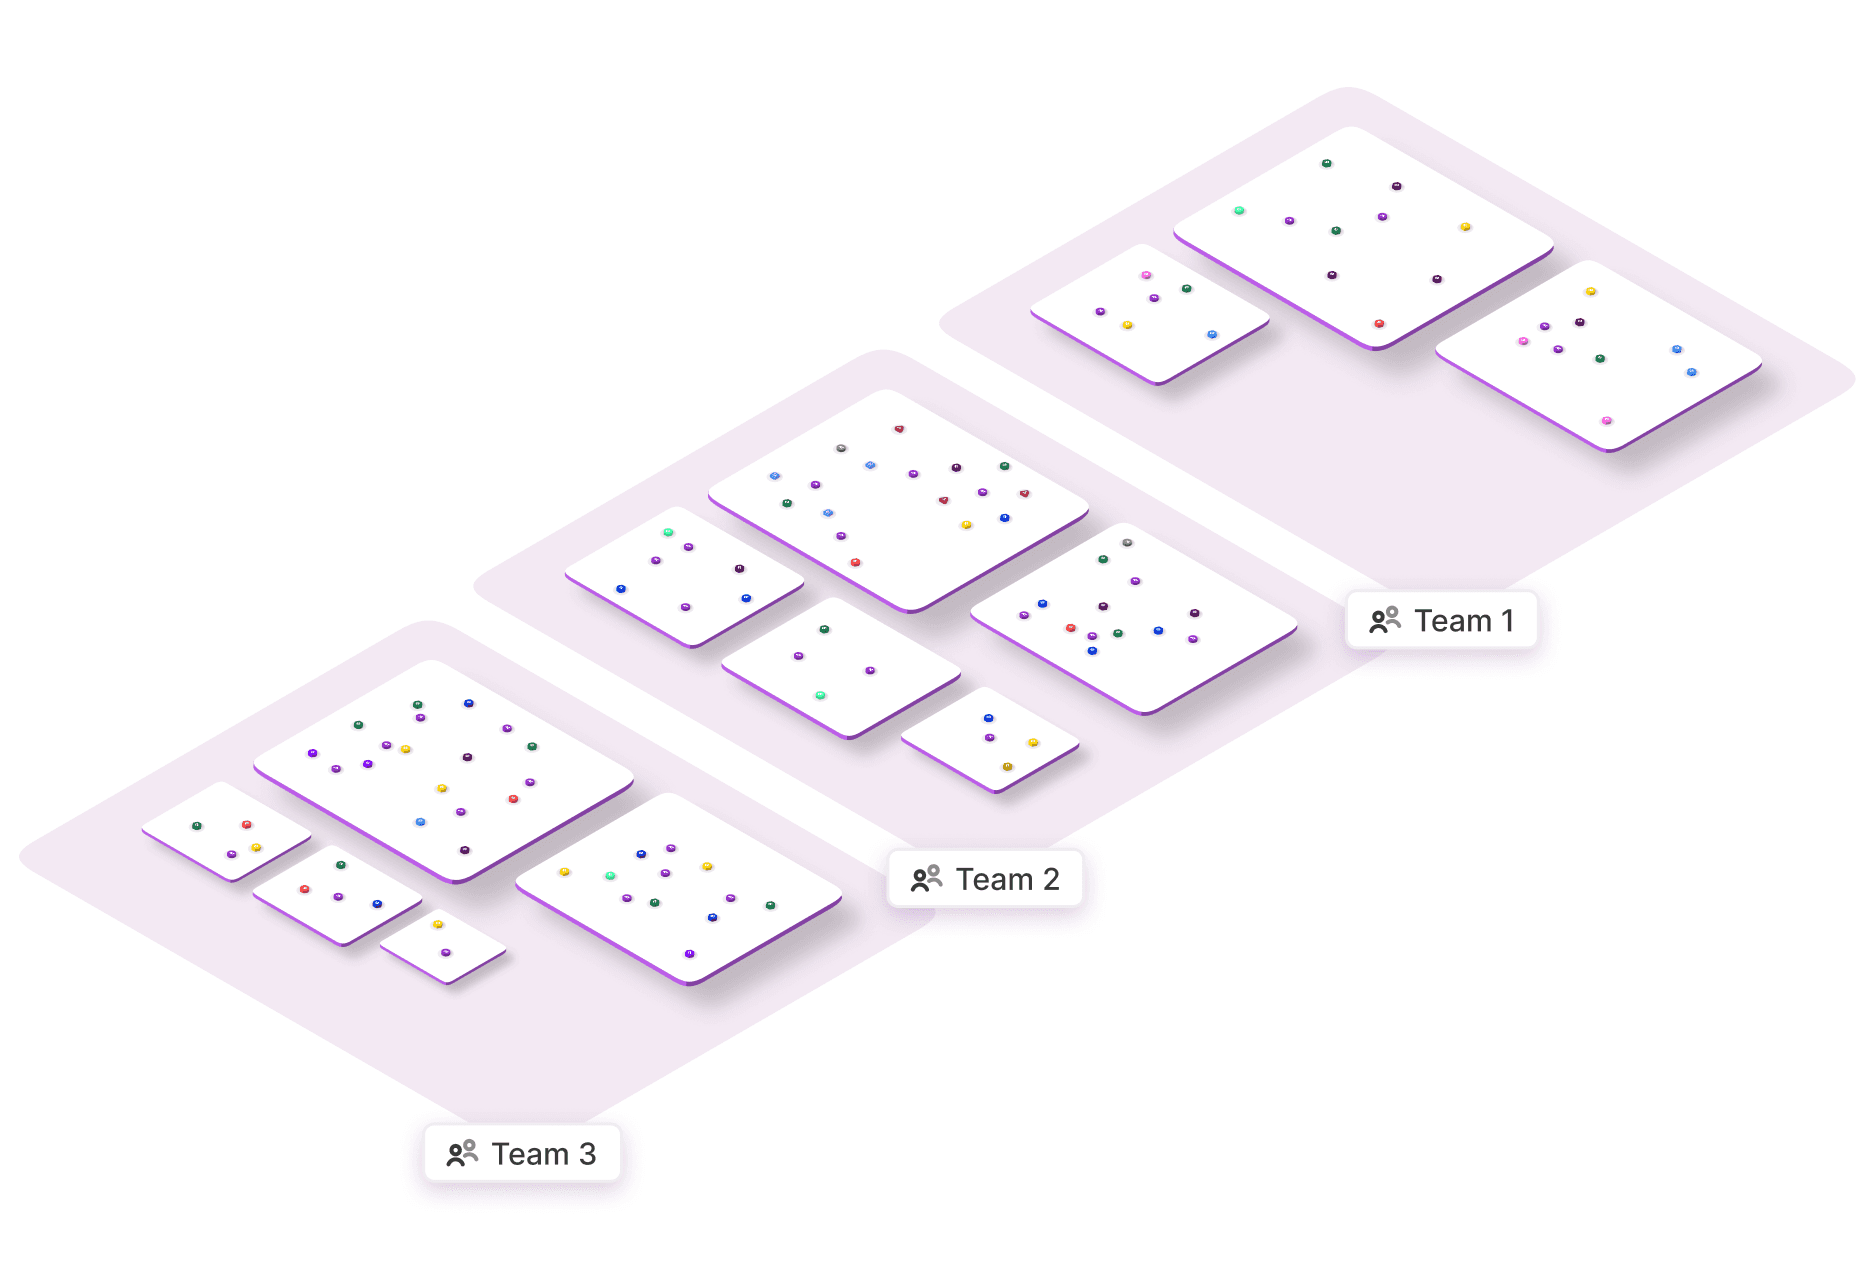
Make Grid, for example, is the three-dimensional way to express how clusters of information ride information freeways – not just through but across workflows, teams, and departments. Representing this visually is how technical and non-technical team members come to speak a common language, how various levels of the org chart collectively make sense of intricate business processes. Visual orchestration is the key to scaling quicker and debugging cross-functional processes faster.
Visibility changes everything
The exact way that you implement visuals in your products will certainly be unique to whatever you're building – and that's a good thing. But as Make's well-loved platform proves, what won't differ is that placing immersive visual elements front and center is non-negotiable in a world of increasingly complex AI-driven processes. So keep dreaming and "get in" to the Grid: fully experiencing your processes will only help you reap the rewards.
Ready to make the automation revolution happen?