Mar 3, 2026 | 5 minutes
How to build an investment-grade company scoring system with Make and alternative data
Discover how to use Make to transform raw alternative data into a structured, explainable company scoring system for investing, corp dev, or GTM prioritization.

Most company scoring systems rely on static firmographic data or non-transparent machine-learning models. The result is either outdated insights or scores that are impossible to explain.
But what if you could build a time-aware, explainable company scoring system using real-world signals without writing any code?
In this guide, we’ll walk through how to use Make and alternative data to build an investment-grade company scoring workflow using Google Sheets as the output layer.
Why alternative data matters for company scoring
Traditional datasets answer questions like:
How big is the company?
Where is it located?
What industry is it in?
Alternative data answers more important questions:
Is the company hiring right now?
Are they investing in leadership and new tools?
Is something changing internally?
By using signals such as job openings, news events, and technology adoption, you can measure momentum instead of static attributes.
Real-world use cases: Who it is for
This type of scoring system can be used for:
Investment screening
Corp dev target prioritization
Sales and GTM account scoring
Partner evaluation
Market monitoring
What makes a scoring system “investment-grade”
Before building the workflow, let’s define the requirements.
An investment-grade scoring system should be:
Time-based - focused on recent activity rather than snapshots
Explainable - every score can be traced back to signals
Composable - signals can be added or removed easily
Automated - no manual updates or scripts
Overview: the Make workflow architecture
At a high level, the scenario looks like this:

Each company is processed independently, and all signals are written back once per run.
Step 1: Set up your company list in Google Sheets
Create a Google Sheet with one row per company:
Example columns:
domain
jobs_90d
jobs_30d
senior_roles_90d
score

This sheet will act as both your input and output layer.
Step 2: Create a new Make scenario
Log in to your Make account
Click Create a new scenario
Add Google Sheets → Get rows as the first module
Select your company list sheet
Build automations via natural conversation with Maia!
Step 3: Iterate through companies
Add:
Tools → Iterator
Map the rows from Google Sheets.
From this point on, every step runs once per company domain.
Step 4: Count job openings in the last 90 days
Now let’s add the first and strongest signal: hiring activity.
PredictLeads → List Job Openings
Configure:
Domain = current row domain
first_seen_at_from = now - 90 days
This returns one bundle per job opening.
Tools → Array Aggregator
Collapse all job bundles into a single array.
Tools → Set variable
Create:
jobs_90d = length(aggregated_jobs)
This gives you the total number of new roles opened in the last 90 days.
Step 5: Identify senior hiring activity
Leadership hiring often signals strategic growth.
PredictLeads → List Job Openings (90 days)
Reuse the same 90-day query.
Filter
Keep only roles where:
seniority ∈ manager, director, head, VP, executive
Array Aggregator + Set variable
Create:
senior_roles_90d = length(aggregated_senior_jobs)
Step 6: (Optional) Add short-term momentum
Repeat the same pattern with a 30-day window:
jobs_30d = job openings first seen in the last 30 days
This allows you to measure hiring acceleration.
Step 7: Update Google Sheets (single write)
At the very end of the scenario:
Add Google Sheets → Update row Match rows by:
domain
Update:
jobs_90d
Jobs_30d
senior_roles_90d
last_scored_at
This ensures all metrics land in the same row.
Why does it give you
This approach ensures:
No race conditions
No partial updates
Fully explainable numbers
Easy debugging
Easy extension
Each dataset is processed independently, and Make acts as the orchestration layer.
Extending the workflow with more signals
Once the jobs block is stable, you can easily add:
News events
Count high-confidence events
Detect negative signals like layoffs
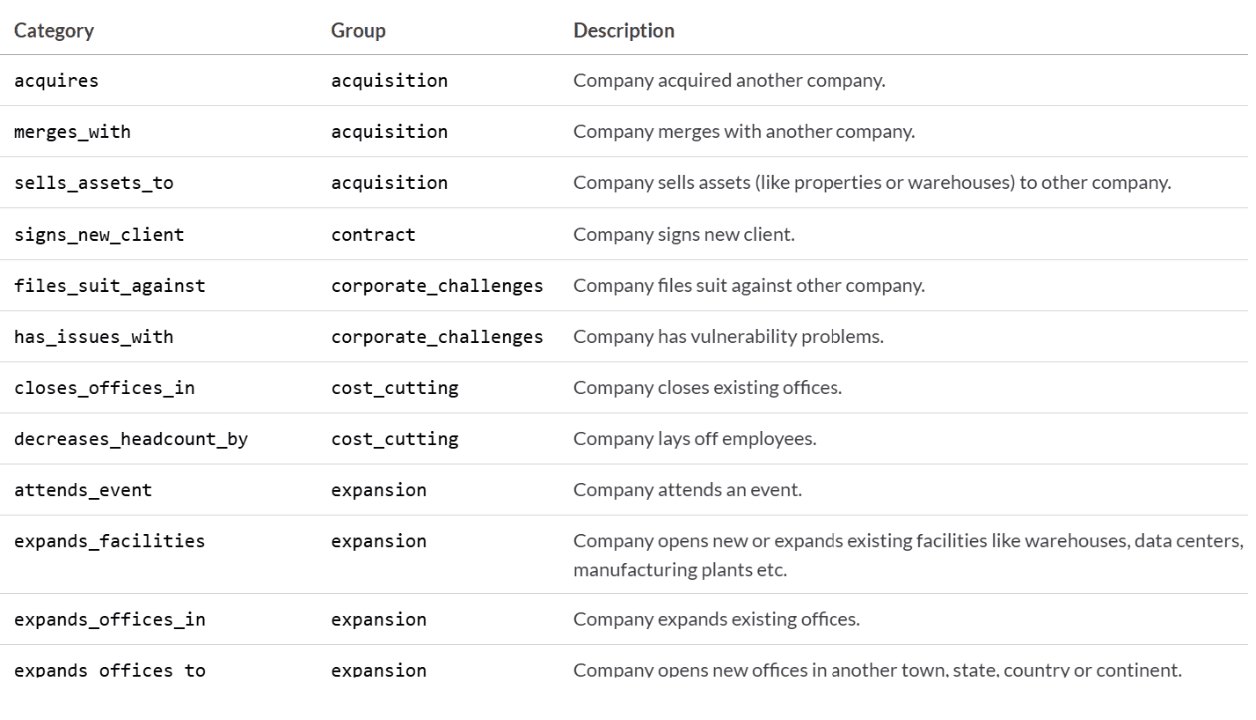
All categories can be found here.
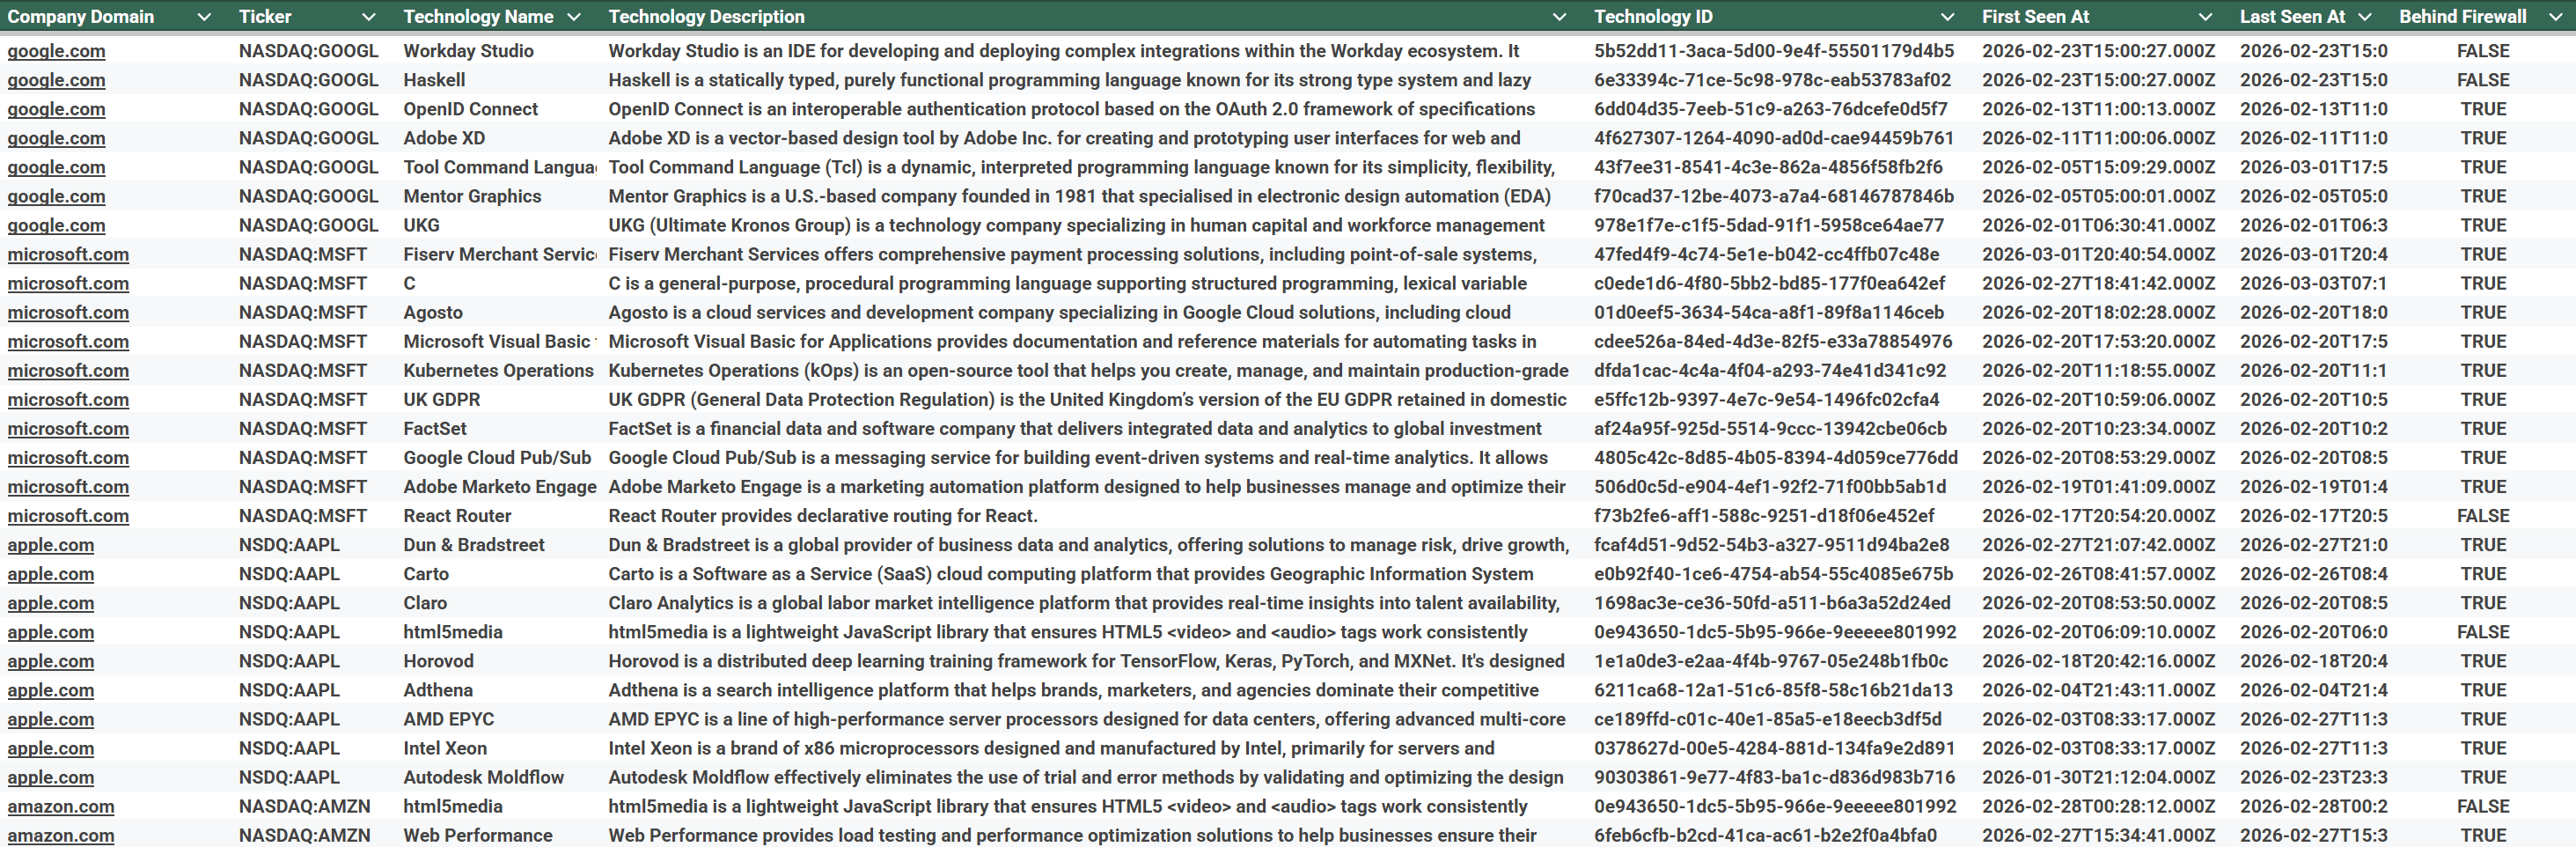
Technology adoption
Measure modern tech stack usage
Detect recent tooling changes
Each signal follows the same pattern:
Fetch → Filter → Aggregate → Variable
Ready to make the automation revolution happen?