Aug 25, 2026 | 6 minutes
Agent observability 2026: see what your agents are doing
Observe exactly what your AI agents did on every run, which tools they called, and why they made each decision.
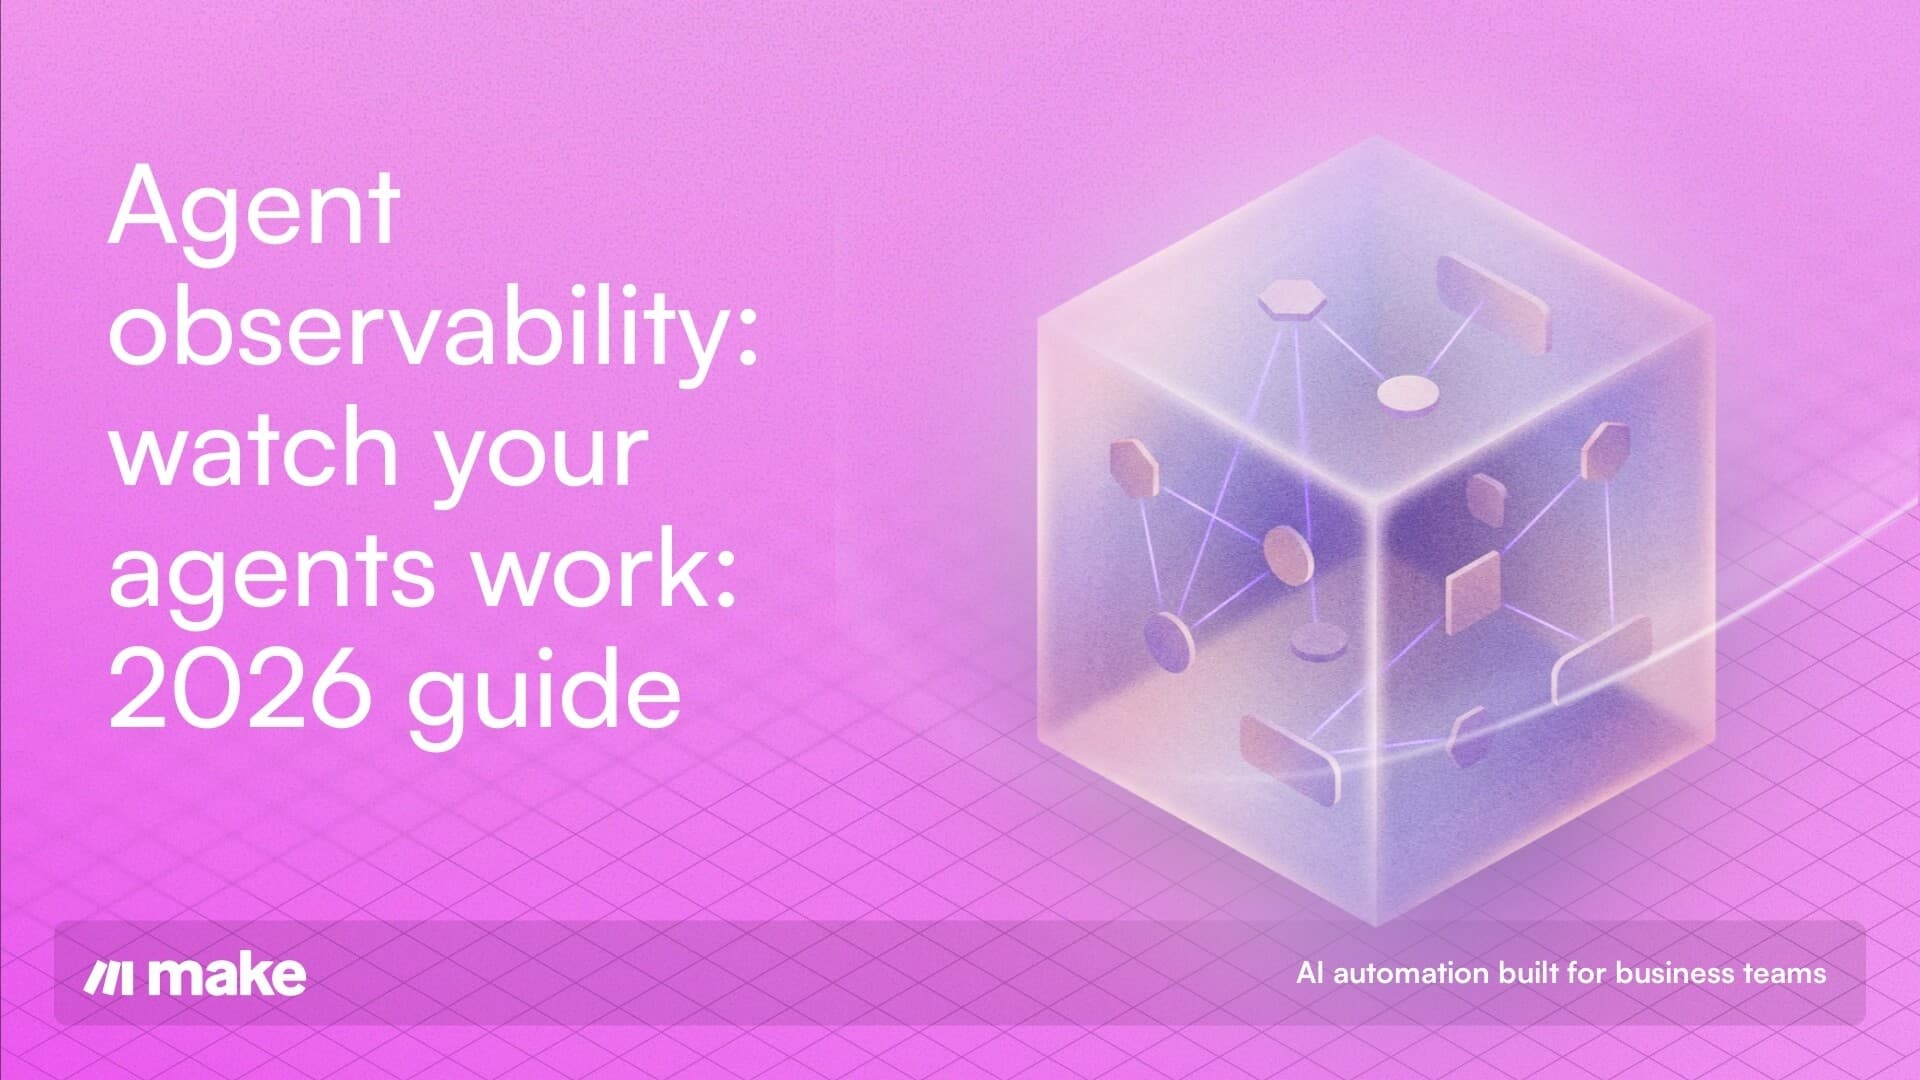
Agent observability is the practice of tracking what an AI agent actually did: which tools it called, what data it retrieved, and why it made each decision, so you can debug failures and prove the agent behaved as intended.
Unlike regular software, an agent can take a different path through the same request every time it runs, which is what makes this visibility necessary rather than optional.
This article covers what agent observability tracks, why it matters, and how to set it up directly in Make.
What is agent observability?
Agent observability extends traditional observability, metrics, events, logs, and traces, to signals unique to AI agent systems: tool calls, retrieved context, token usage, and the reasoning steps that connect one action to the next.
IBM frames AI agent observability as the process of monitoring and understanding the end to end behavior of an agentic system, including its interactions with large language models and external tools, which is a useful way to frame what you are actually watching for.
Regular tools follow fixed logic, so the same input produces the same path through the code every time. Agents do not work that way.
Given the same request, an agent might call a different tool, retrieve a different document, or reach a different conclusion on two separate runs.
That variability is what makes agents useful for handling messy, real world requests, and it is also what makes them hard to debug without visibility into every step, not just the final output.
This difference matters for anyone rolling agents out beyond a single pilot. A support agent that answers correctly nine times out of ten is not obviously broken from the outside.
Only a record of what it did on the tenth run tells you whether it picked the wrong tool, misread a document, or ran into a genuine edge case worth fixing.
Why does agent observability matter?
Without observability, an agent is a black box: you see what went in and what came out, with no record of the decisions in between.
That gap creates three concrete risks. Compliance suffers when you cannot show why an agent approved a claim or rejected a loan application.
Operational failures compound when teams cannot trace a bad outcome back to the specific tool call or retrieval step that caused it.
Trust erodes quickly when an agent makes a visible mistake in front of a customer and nobody can explain why.
Part of the risk comes from how agents are built. Make's guide to nondeterministic automation describes how agents trade the predictability of fixed rules for the flexibility to handle requests nobody explicitly programmed for.
That tradeoff pays off in practice, but only if you can see the path an agent took, not just guess at it after something goes wrong.
Adoption is moving faster than most teams' visibility into it. According to LangChain's agent engineering report, 89% of organizations have used some form of agent observability, and 62% already use detailed step level tracing.
As more of your operational work runs through agents rather than fixed rules, the ability to answer "what did the agent actually do on this run" stops being a nice to have and becomes a basic requirement for running them in production.
What does agent observability actually track?
The data splits into three connected layers: traces and spans that show the path an agent took, metrics that quantify its performance, and logs that record the detail behind each step.
What are traces and spans in an agent run?
A trace is the complete record of one agent run from the initial request to the final response.
A span is a single step inside that trace, such as one model call, one tool call, or one retrieval query.
Together, they let you reconstruct exactly what happened, in order. A typical agent trace captures:
The input that triggered the agent
Each tool the agent called, with the arguments it passed
The documents or data it retrieved
The model's response at each reasoning step
The final output returned to the user
This structure is increasingly standardized.
The OpenTelemetry project's GenAI semantic conventions define a common vocabulary for describing these spans, so traces from different frameworks and vendors can be read consistently.
Which metrics matter for AI agents?
Metrics turn individual traces into a picture of overall health.
The most useful ones to watch are token usage and cost per run, latency at each step, the error or failure rate of tool calls, and task success, meaning how often the agent actually completes what it was asked to do.
Reviewing these regularly, rather than only after a customer complains, is part of running an agentic operating system rather than a one off experiment.
Metric | What it tells you |
Token usage | Cost per run and which requests are unusually expensive |
Latency | Whether a slow step is hurting user experience |
Tool error rate | Which integrations or APIs are failing most often |
Task success rate | Whether the agent is actually solving the problem it was given |
What do logs and events add?
Logs are the detailed, timestamped record behind each span: the exact prompt sent to the model, the raw response from a tool, or the moment an agent escalates a request to a human.
Events mark the significant actions worth reviewing on their own, including failed tool calls, alert notifications, and human handoffs.
Together, logs and events are what you search through when a metric flags a problem and you need to find the specific run that caused it, rather than reconstructing the sequence from memory or a support ticket.
How do you build agent observability with Make?
Rather than bolting on a separate tracing tool, you can get most of the visibility above directly from how Make already runs scenarios, and you can build each piece using Maia, Make's AI copilot, by describing what you want in plain language instead of configuring modules by hand.
The four steps below map to the traces, metrics, and logs covered above, in the order you would typically set them up.
1. How do you see what your agent decided?
The Make AI Agent (New) > Run an agent module shows a step by step reasoning panel for every run: which tools it called, what arguments it passed, and how it got from the request to the final answer.
This gives you trace level visibility without adding separate instrumentation.
Start by describing the agent's job to Maia, Make’s powerful new AI assistant that lives inside your Scenario Builder, in plain language.
Maia prompt:
"Create a scenario with a Make AI Agent module that reads new support tickets from Zendesk and drafts a reply. Give it access to my knowledge base as a tool, and set it up so I can review its reasoning for each ticket."
2. How do you track every run automatically?
Every scenario writes to its automatically, recording run status, duration, operations consumed, and the bundles each module produced.
That covers the metrics and events layer with no extra setup. Because the agent scenario is triggered by each new Zendesk ticket, adding an export step inside it would write to Google Sheets once per ticket, not once a day.
Make's scheduling applies to the whole scenario, not a single step, so a daily rollup needs a second scenario on its own schedule. Create a new scenario then use this Maia prompt below.
Maia prompt:
"Create a new scenario, scheduled to run once a day, that uses Make > List scenario logs to pull today's run status, duration, and operation count for my agent scenario, then adds each entry as a row in a Google Sheets tab called Agent runs using Google Sheets > Add a row."
3. How do you catch and route failures?
Add an error handler to catch failed tool calls or unexpected model output before it reaches a customer.
Pair it with a Router module to decide whether to retry, fall back to a default response, or hand off to a person.
Make's error handling tools support automatic retries with exponential backoff, so a single flaky API call does not stop the whole run.
Maia prompt: "
Add an error handler to my agent scenario that retries a failed tool call twice with exponential backoff. If it still fails, send the ticket details and error message to my team's Slack channel using Slack > Create a Message."
4. How do you evaluate and improve over time?
Observability only pays off if you act on it.
You should route your scenario runs where the agent escalated to a human, or where a customer marked a response unhelpful, into a place you actually review.
Then use that pattern to update the agent's system prompt, tools, or agent workflow memory.
Maia prompt:
"Whenever my agent hands a ticket to a human or gets a negative rating, save the run details to a Data store called Agent review queue, and send me a weekly Slack digest of everything in it."
Which agent observability tool should you choose?
For teams whose agents run inside existing app workflows, the visibility above, a reasoning panel, automatic scenario history, and error handlers, is a solid baseline with nothing extra to install.
For teams running high volume agents built in code, with dozens of tool calls per run across custom pipelines, a dedicated tracing platform adds depth that a general automation history cannot.
Category | Example | Best for |
Built in automation visibility | Make | Agents embedded in existing operational workflows |
Framework native tracing | LangSmith, Arize Phoenix | Engineering teams building custom agents in code |
Enterprise observability platforms | Datadog, Azure Monitor | Teams standardized on one cloud or APM vendor |
Security led platforms | Zenity | Security teams tracking agent sprawl and data access |
Our guide to AI agent platforms covers the build and governance tradeoffs across these options in more depth.
A reasonable rule of thumb: if you can still name every agent in your organization and describe what each one does, built in visibility is probably enough.
Once that list gets long enough that no single person can hold it in their head, a dedicated platform earns its cost.
If you do reach for a dedicated agent tracing platform, look for one that supports OpenTelemetry so it can sit alongside the automation history you already have rather than replacing it.
What should you do next?
Agent observability is not a separate project bolted onto your agents after launch.
It is the reasoning panel, run history, and error handling you already get by building agents in Make, plus a habit of reviewing what they flag.
Start with one agent, watch what it does for a week, and let that review shape the next version.
Visit the AI Agents page to build your first agent and see its reasoning for yourself.
Frequently asked questions
Q1: What is the difference between agent observability and traditional APM?
Traditional APM tracks requests, servers, and response times. Agent observability adds AI specific signals, including which tools an agent called and why it chose one path over another, since the same input can produce a different route each run.
Q2: Do you need agent observability for a single step AI workflow?
Not always. If an agent makes one model call with no tools, basic logs are usually enough. Add tracing once it chains multiple tools, runs many times a day, or someone besides its builder needs to debug it.
Q3: What role does OpenTelemetry play in agent observability?
OpenTelemetry is an open source standard for collecting traces, metrics, and logs. Its GenAI conventions give agent telemetry a common structure, so tools from different vendors can read the same trace data.
Q4: What is the difference between agent observability and agent evaluation?
Observability shows you what happened during a run. Evaluation judges whether that outcome was good, using methods like LLM as a judge or code based checks against a known correct answer.
Q5: Can you get agent observability without building a custom stack?
Yes. Make AI Agents show a reasoning trace for every run, and every scenario keeps its own history automatically. See the first AI agent guide for a walkthrough of setting one up.
Ready to make the automation revolution happen?